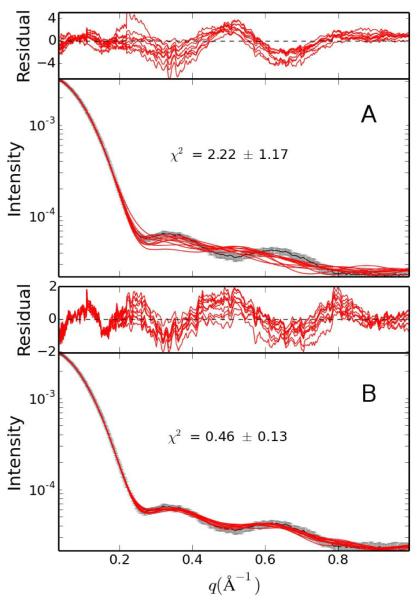
Figure 3.
Comparison of SAXS/WAXS curves for hen egg white lysozyme. Panels A and B depict the agreement to experiment of the SAXS/WAXS curves associated with the 10 lowest energy structures calculated without and with SAXS/WAXS data, respectively. The experimental data is shown in black with gray vertical bars equal to 1 SD.; the curves calculated from the simulated annealing structures are shown in red. The residuals, given by , are plotted above each panel.

