
Figure 8.
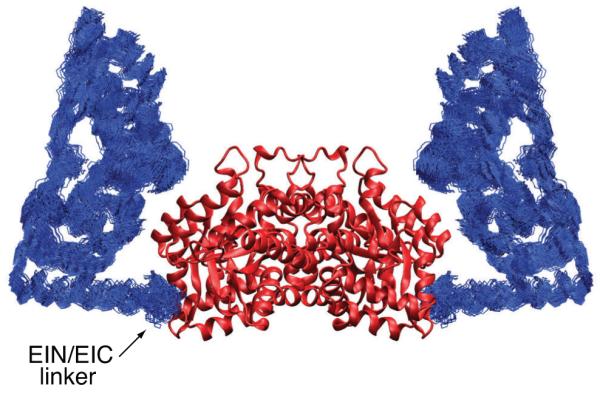
The structure of free EI determined from RDC and SAXS data. A best-fit superposition (to the EIC dimer which remains fixed) of the 100 final simulated annealing structures. The backbone (N, Cα , C’) atoms of the EIN domain are shown in blue, and the EIC domain is depicted as a ribbon diagram in red. Adapted from Schwieters et. al. [18] published in J. Am. Chem. Soc. (American Chemical Society) while the authors were U.S. Government employees at the National Institutes of Health.