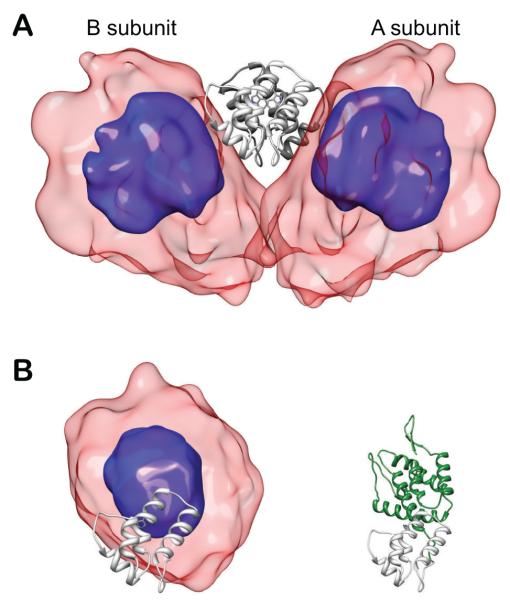
Figure 9.
Structural ensembles calculated for the wild-type capsid (CAFL) dimer (A) and monomer (B). In panels A and B the C-terminal domain is displayed as light gray ribbons. In panel B the C-terminal domain of the monomer is displayed in the same orientation as that of the A subunit in panel B. The overall distribution of the N-terminal domain relative to the C-terminal domain is displayed as a reweighted atomic probability [40] plotted at 50% (blue) and 10% (transparent red) of maximum. Additionally, a single complete monomer structure is plotted in panel B (with the N-terminal domain depicted in green) which corresponds to one cluster of ensemble members which form transient contacts in the monomer and would be occluded in the dimer ensemble. Adapted from Deshmukh et. al. [22] published in J. Am. Chem. Soc. (American Chemical Society) while the authors were U.S. Government employees at the National Institutes of Health.

