Figure 3.
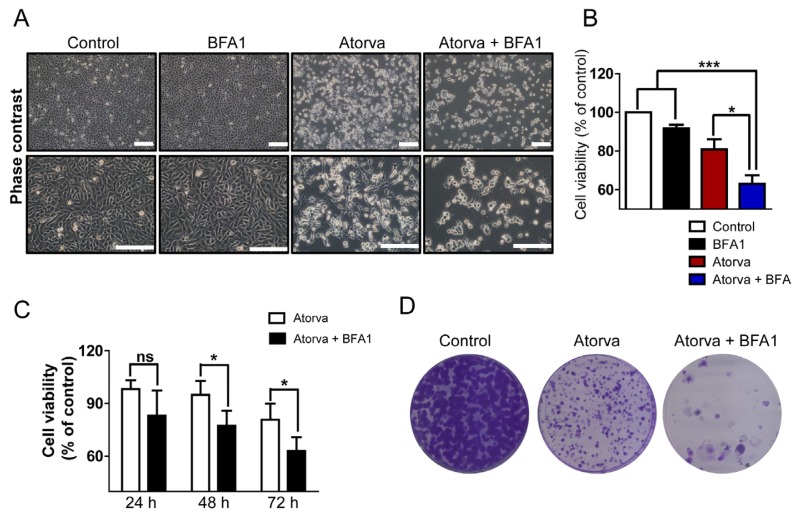
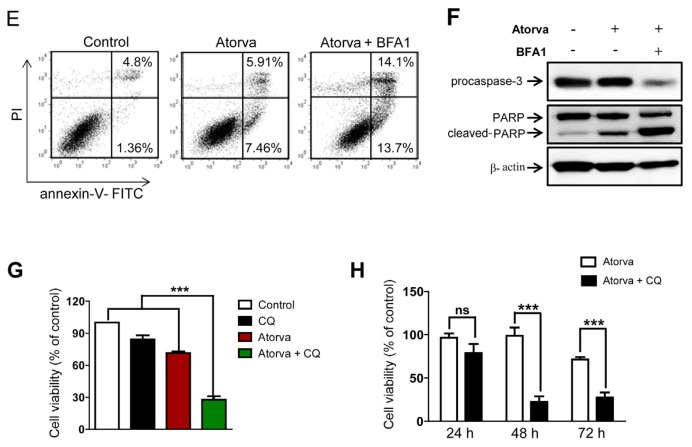
Autophagy inhibition enhances atorvastatin-induced apoptotic cell death in T24 bladder cancer cells. (A) Phase contrast images of untreated T24 cells (control), treated T24 cells with 20 μM of bafilomycin A1 (BFA1), 20 μM of atorvastatin (Atorva) and both these agents (Atorva + BFA1) for 48 h. Scale bar = 200 μm; (B) The cell viability assay to examine the cytotoxic effects of 20 μM of bafilomycin A1 (BFA1), 20 μM of atorvastatin (Atorva) and both these agents (Atorva + BFA1). The values of cell viability are represented by the mean percent of control ± SEM (n = 3, * p < 0.05, *** p <0.001); (C) The cell viability assay to compare the cytotoxic effects of 20 μM of atorvastatin and combined treatment with 20 μM of BFA1 and atorvastatin over three different durations (24, 48 and 72 h). Representative values of cell viability are represented by the mean percent of control ± SEM (n = 3, * p < 0.05; ns, not significant); (D) The clonogenic assay to compare in vitro cell survival potential after treatment with 20 μM of atorvastatin and combined treatment with 20 μM of atorvastatin and BFA1 for 12 days. The colony is defined as containing at least 50 individual cells. Photographs represent each experimental group stained with the clonogenic assay kit; (E) Flow cytometry analysis with FITC-conjugated annexin-V and PI staining to examine apoptotic cell death in T24 cells treated with 20 μM of atorvastatin and combined treatment with 20 μM of BFA1 and atorvastatin for 48 h. Relative proportions of both early and late apoptosis are indicated in right lower and right upper quadrant, respectively in each treatment group; (F) Western blot analysis of apoptotic markers procaspase-3, total PARP and cleaved-PARP in T24 cells treated with 20 μM of atorvastatin and both 20 μM of BFA1 and atorvastatin for 48 h; (G) The cell viability assay to examine the cytotoxic effects in T24 cells treated with 20 μM of chloroquine (CQ), 20 μM of atorvastatin and both these agents. The values of cell viability are represented by the mean percent of control ± SEM (n = 3, *** p < 0.001); (H) The cell viability assay to compare the cytotoxic effects in T24 cells treated with 20 μM of CQ, 20 μM of atorvastatin and both these agents over three different durations (24, 48 and 72 h). Representative values of cell viability are represented by the mean percent of control ± SEM (n = 3, *** p < 0.001; ns, not significant).


