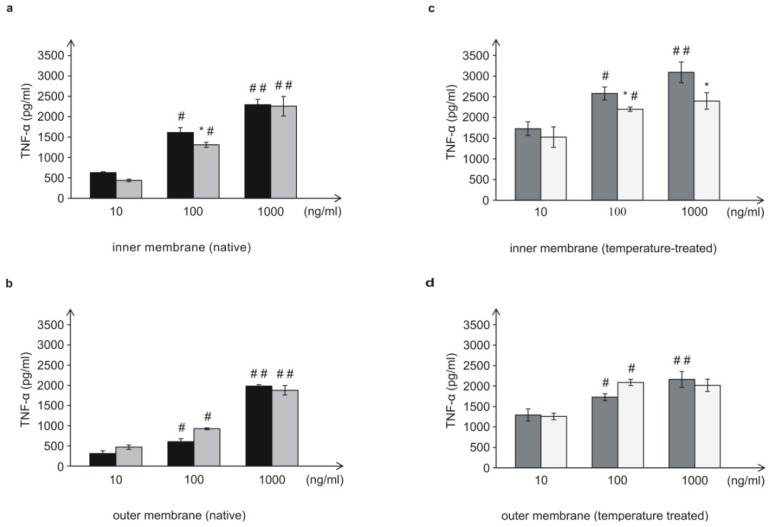
Figure 9.
TNF-α (pg/mL) induction in the THP-1 differentiated cells by the outer and inner membrane of L. dumoffii (a,b,c,d). Control THP-1 differentiated cells (PMA-activated): TNF-α 22.6 ± 0.60 (pg/mL); Control non-activated THP-1 cells: TNF-α 18.32 ± 0.90 (pg/mL). Data represent the mean ± S.D. of five independent experiments; #—Significantly different from the lower (10 ng/mL) membrane concentration, p ≤ 0.05; ##—Significantly different from the lower (100 ng/mL) membrane concentration, p ≤ 0.05; *—Statistically significant in comparison to bacteria cultured on the choline non-supplemented medium, p ≤ 0.05 (ANOVA and Tukey’s post hoc test).
 —membrane from bacteria cultured on the choline non-supplemented medium.
 —membrane from bacteria cultured on the choline-supplemented medium.
 —temperature-treated membrane from bacteria cultured on the choline non-supplemented medium.
 —temperature-treated membrane from bacteria cultured on the choline-supplemented medium.

