Figure 3.
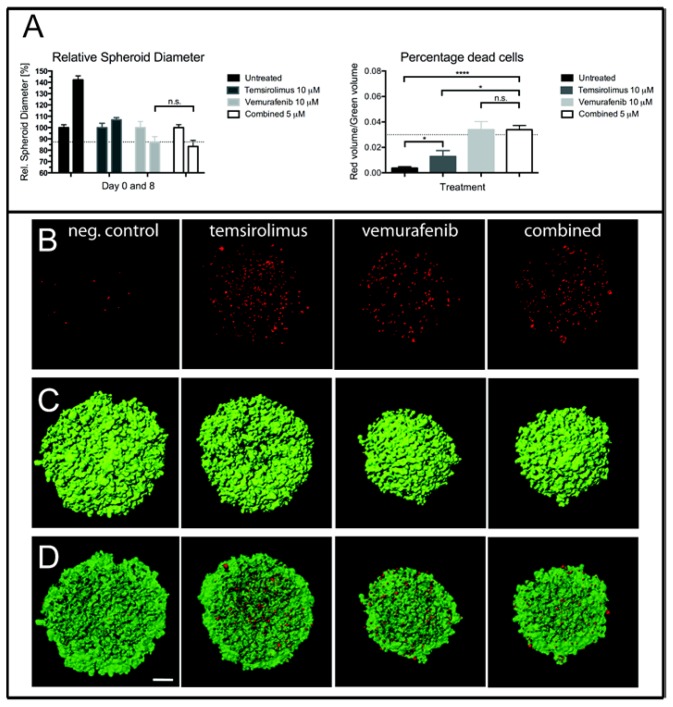
Multicellular spheroid growth of H1_DL2 cells after treatment with vemurafenib and temsirolimus. (A, left) Spheroid diameters measured zero and eight days after treatment with 10 μM of temsirolimus, 10 μM of vemurafenib or the combined treatment (5 μM temsirolimus + 5 μM vemurafenib) (n = 6, mean ± SD). n.s.: not significant; * p < 0.05, **** p < 0.0001. (A, right) The percentage of dead cells within the spheroids after treatment for three days with 10 μM of temsirolimus, 10 μM of vemurafenib or the combined treatment (5 μM temsirolimus + 5 μM vemurafenib); (B) Maximum intensity projection images of the red channel (dead cells) of confocal image stacks of spheroids treated with 10 μM of temsirolimus, 10 μM of vemurafenib or the combined treatment (5 μM temsirolimus + 5 μM vemurafenib); (C) The surface volume of the green channel (live cells) of the same spheroids as in (B); and (D) An overlay of the red and green volume surfaces of the same spheroids as in (B). Scale bar = 100 μm. neg. control = negative control.

