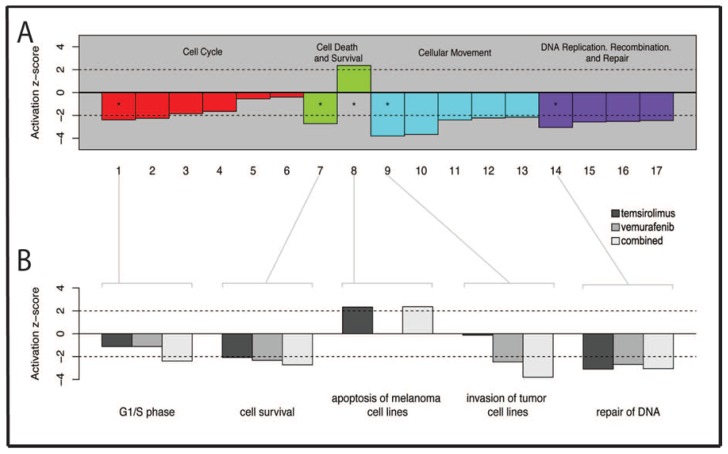
Figure 7.
Ingenuity function analysis. (A) Bar plot of the activation z-scores of selected downstream functions in combination treated samples (5 μM vemurafenib and 5 μM temsirolimus) compared to untreated cells. Functions with z-scores greater than two are predicted as being “activated” in this comparison, while those with scores less than −2 are “inhibited”. All columns were statistically significant; p < 0.005. Column numbers correspond to the list of downstream functions shown in Table 3; and (B) A detailed presentation of bar plots of activation z-scores, showing the most activated downstream functions for each of the three treatments; 25 μM temsirolimus vs. untreated cells, 15 μM vemurafenib vs. untreated cells or 5 μM vemurafenib + 5 μM temsirolimus vs. untreated cells. All columns were statistically significant; p < 0.005.

