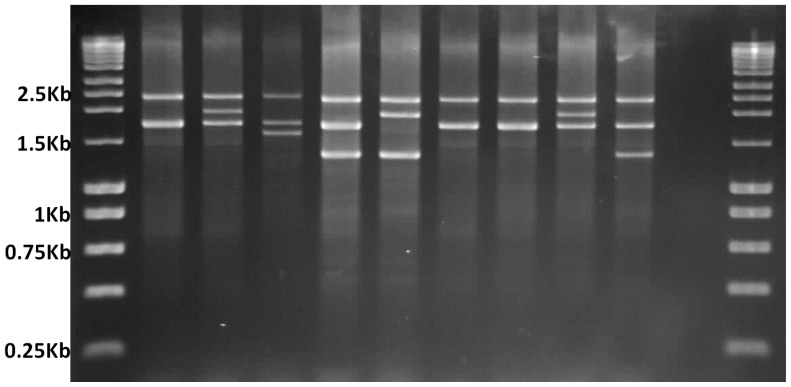
Figure 1.
Multiplex-Gap PCR genotype analysis of the α-globin gene cluster on agarose gel electrophoresis. Lanes 1 and 12 (left to right) show DNA marker ladders; 2350 bp band on lane 2 depicts the internal control and 1800 bp band indicates the presence of normal α2 globin gene. Lanes 3–5 are positive controls for heterozygous −α3.7 deletion, −α4.2 deletion, and −−SEA deletion; Lanes 6–10 are patients where lane 6 shows compound heterozygosity for −α3.7 and −−SEA deletions; Lanes 7 and 8 “none of the deletion tested present”; Lane 9 −α3.7 deletion; Lane 10 −−SEA deletion; and Lane 11 is non-template control.

