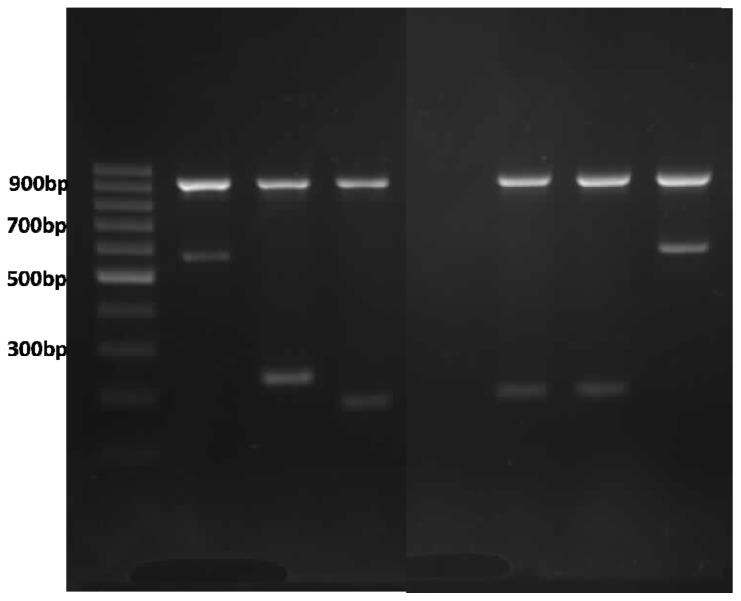
Figure 2.
Multiplex ARMS PCR genotype analysis of α globin gene cluster on agarose gel electrophoresis. Lane 1 ladder; Lanes 2–4 are positive controls for Cd 59 (G > A), Cd 125 (T > C), and term Cd TAA > CAA (Hb CS) with their respective bands; Lane 5 non-template control; Lanes 6 and 7 Hb CS; and Lane 8 Cd 59 (G > A); 930 bp bands on Lanes 2–4 and 6–8 are internal control bands amplifying a segment of 3′ UTR of LIS1 gene.

