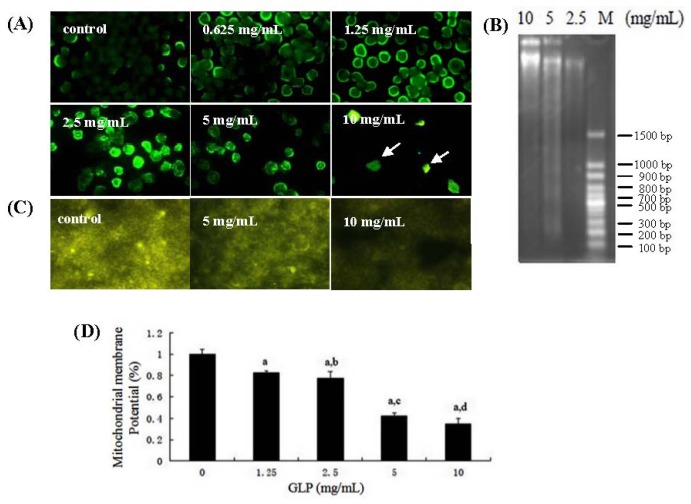
Figure 4.
Effects of GLP on apoptosis in HCT-116 cells. (A) Apoptotic cells measured by Hoechst 33,258 staining after treatment with GLP for 48 h under a fluorescence microscope (×200). The arrows show cell fragments; (B) HCT-116 cells were exposed to the indicated concentrations of GLP for 24 h. DNA was isolated and examined on 1.2% agarose gel; (C) Mitochondrial membrane potential (ΔΨm) was monitored by microscopy and photographed at each concentration of GLP; and (D) quantitative evaluation. Data are presented as mean ± SD. a, p < 0.01 compared with control. b, c and d, p < 0.01 compared with 1.25, 2.5 and 5 mg/mL GLP treatment, respectively.

