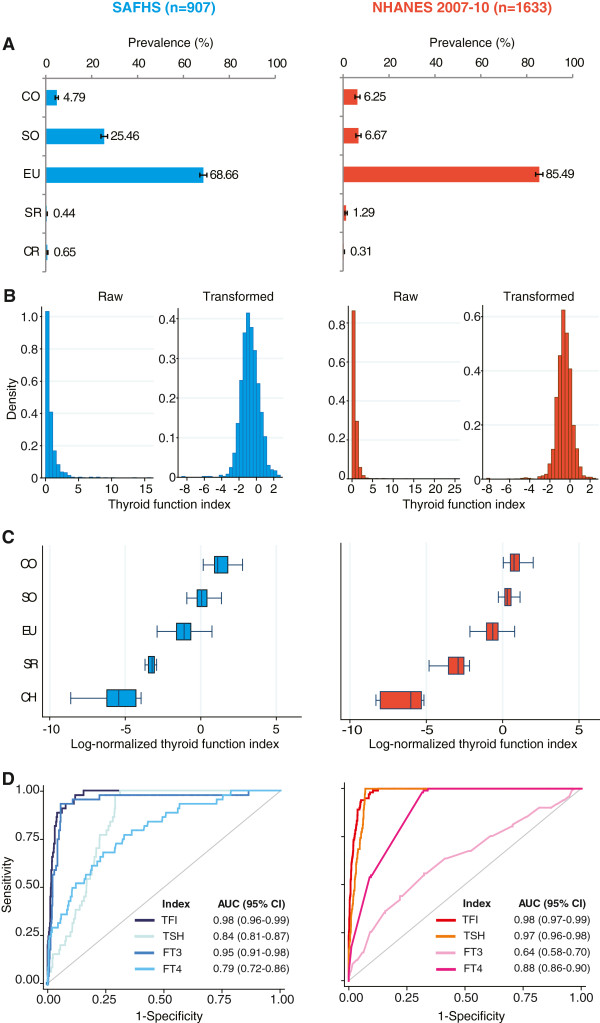
Figure 1.

Development and validation of thyroid function index (TFI) as a marker of thyroid function. Results are color coded as blue for SAFHS and red for NHANES 2007–10 participants. (A) Spectrum of clinical thyroid status. Bars represent prevalence (%) while error bars represent 95% confidence interval. CO, clinical hypothyroidism; SO, subclinical hypothyroidism; EU, euthyroid; SR, subclinical hyperthyroidism; CR, clinical hyperthyroidism. (B) Effect of log-transformation on distribution of TFI. Left and right panels show histograms for raw and log-transformed TFI, respectively. (C) Box and whisker plots showing distribution of log-normalized TFI by thyroid status. (D) Receiver operating characteristics (ROC) curves comparing the discriminatory performance of TFI, TSH, FT3 and FT4 to detect clinical hypothyroidism. AUC, area under the ROC curve; CI, confidence interval.
