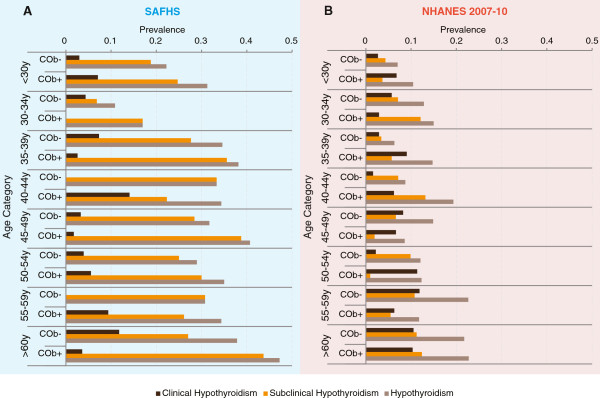
Figure 3.

Utility of central obesity as an additional screening measure to detect thyroid dysfunction. Results for SAFHS participants are shown on the blue background in (A) while those for the NHANES 2007–10 participants are shown on pink background in (B). Each panel shows color coded bars representing prevalence of the indicated clinical thyroid status within each age category. COb+, central obesity present; COb-, central obesity absent.
