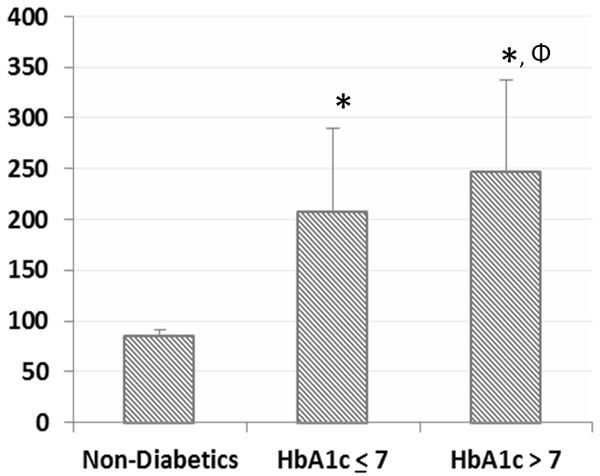
Figure 1.

Mean values of fasting serum glucose (mg/dl) according to the subgroups, including non-diabetics, HbA1c≤7 and HbA1c>7. Data are shown as the mean ± standard deviation. P values were calculated using the One-Way ANOVA and posthoc Tukey HSD. (*) p<0.001 when compared to non-diabetics. (Φ) p<0.05 when compared to HbA1c≤7 group.
