
Figure 3.
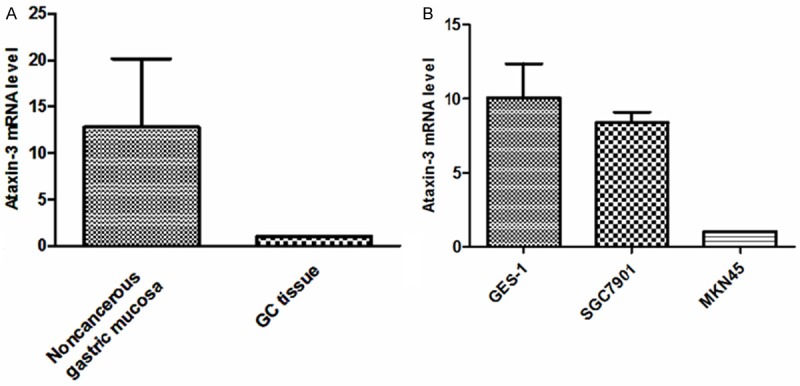
Quantitative RT-PCR analysis of Ataxin-3 mRNA expression. Ataxin-3 mRNA expression was lower in gastric cancer tissues and gastric cancer cell lines than in the control noncancerous gastric tissues and cell line. A: Expression of Ataxin-3 mRNA in human tissue samples (GC - n = 14; noncancerous gastric mucosa - n = 14; Standard Error of the Mean (SEM), experiment performed in triplicate; Ataxin-3 mRNA expression relative to GAPDH). B: Expression of Ataxin-3 mRNA in human GC cell lines (MKN45 and SGC7901) and in normal gastric epithelial cells (GES-1).