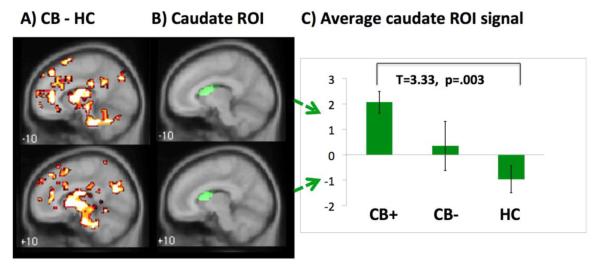
Figure 1.

A shows cluster-level corrected whole-brain comparisons of cannabis dependent (CB) participants versus healthy comparison (HC) participants (pFWE<.05) during the presentation of losing outcomes (versus neutral outcomes).
B shows the anatomical caudate ROI which was used to extract individual participants’ signals (plotted in Figure 1C).
C shows mean (± standard error) signal change within caudate ROI for abstinent individuals with cannabis dependence (CB+), non-abstinent individuals with cannabis dependence (CB−) and healthy comparison (HC) participants. R=right, L=left.
