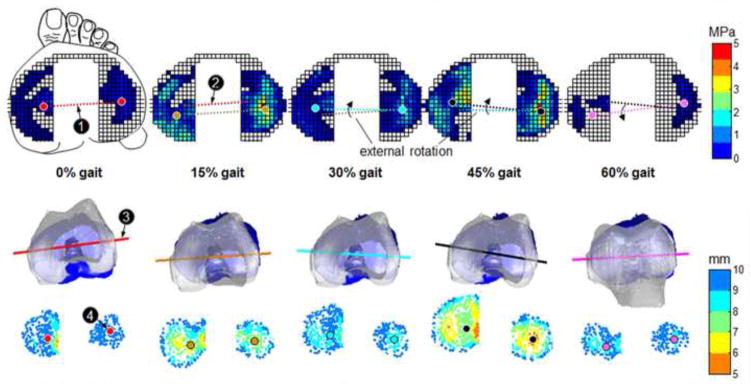
Figure 4.

Color map of the directly measured knee joint contact stress (1st row) and the closest proximity (3rd row) on tibia plateaus at different time of gait cycle for a typical specimen. The 2nd row represents the relative tibiofemoral position in the tibial local coordinate system during the stance phase of gait cycle. ‘1’-axis connecting the medial and lateral weight center of contact (WCoC), ‘2’-the axis at the previous timing, ‘3’-transepicondylar axis of femur, ‘4’ – weighted center of proximity (WCoP).
