Figure 1.

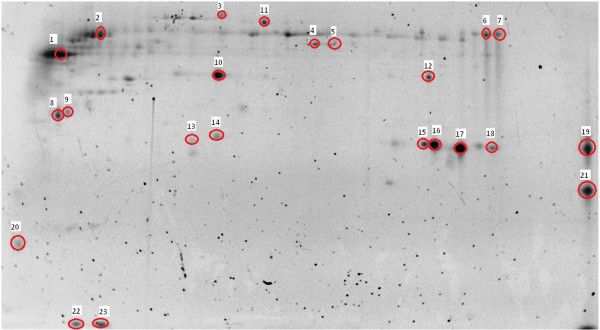
Analyzed protein spots. Representative Ae. aegypti saliva 2-D gel image (12.5% Tris–HCl in TGS buffer using a pH 3–10 non-linear IPG strip) with the spots that were cut circled and numbered to match the IDs in Table 1.

Analyzed protein spots. Representative Ae. aegypti saliva 2-D gel image (12.5% Tris–HCl in TGS buffer using a pH 3–10 non-linear IPG strip) with the spots that were cut circled and numbered to match the IDs in Table 1.