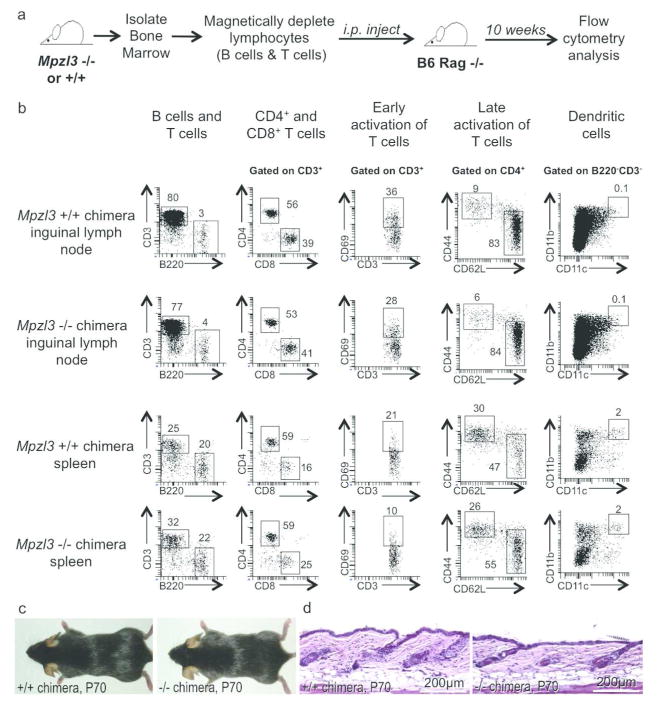
Figure 3. Flow cytometry of reconstituted immune populations in bone marrow chimeras between Mpzl3 −/− or +/+ mice and immunodeficient Rag knockout mice.
(a) Schematic diagram of the procedure. (b) Representative flow cytometry plots of one pair of reconstituted mice (N=3 each), showing immune cell phenotypes in inguinal lymph nodes (top two rows) that drain the skin, and in the spleen (bottom two rows) that drain the blood circulation. Different surface markers were used for flow cytometry analysis to study different immune populations as indicated. Numbers in plots represent percentage of parent population. (c, d) Gross phenotype (c) and dorsal skin histology (d) of the chimeras showed no apparent differences. Scale bars = 200 μm.

