
Fig. 2.
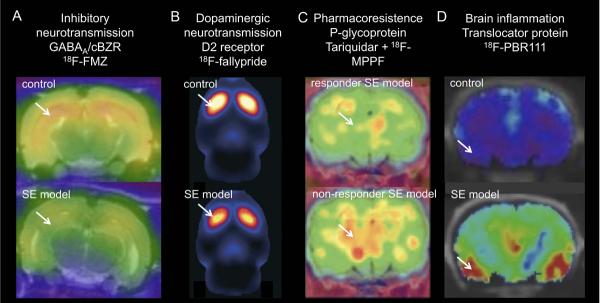
Application of new PET tracers in epilepsy models. A) Decrease in 18F-FMZ PET binding in epileptic rats (kainic acid-induced SE model) compared to control rats. Coronal PET/MRI images are shown at the level of the ventral hippocampus. B) Decrease in 18F-fallypride binding in epileptic animals (pilocarpine-induced SE model) indicative of reduced dopamine D2/3 receptor availability. Sagittal PET image through the rat striatum. C) Increased k1 of P-gp substrate 18F-MPPF in non-responders to phenobarbital (model for drug resistance) after tariquidar (P-gp inhibitor) treatment compared to responder epileptic rats (electrical-induced SE). Mean parametric map of unidirectional blood-brain clearance (k1) superimposed on a coronal rat brain histological atlas at the level of the dorsal hippocampus. D) Increased 18F-PBR111 binding 7 days post kainic acid-induced SE. Coronal PET/CT images of control and SE model. Arrows indicate altered tracer uptake. Abbreviations: SE, status epilepticus. Images reproduced with permission.22, 25,26