
Fig. 4.
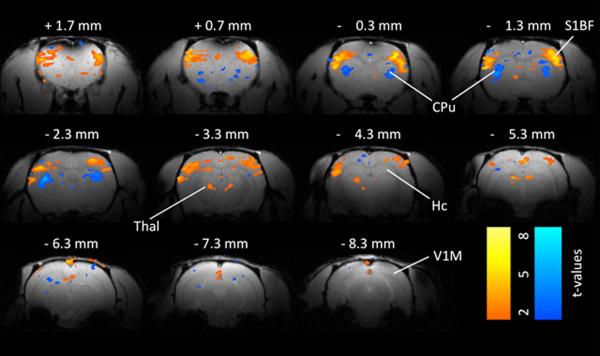
Example of BOLD fMRI changes 2– 4 s after spike-wave discharge onset in a WAG/Rij rat. A. Somatosensory cortex and thalamus (Thal) show prominent increases in BOLD signal during the spike-wave discharges. Prominent BOLD decreases are present in the caudate-putamen (CPu). Smaller changes are seen in other areas. Simultaneous EEG acquired during fMRI was used to identify images obtained 2– 4 s after SWD onset for comparison with baseline images obtained immediately before start of SWDs. Color bars indicate t values for increases (warm colors) and decreases (cold colors). Threshold value t > 2. Abbreviations: CPu caudate-putamen, Hc hippocampus, S1BF somatosensory barrel cortex, Thal thalamus, V1 primary visual cortex. Reproduced with permission. Modified from Mishra et al.51 with permission.