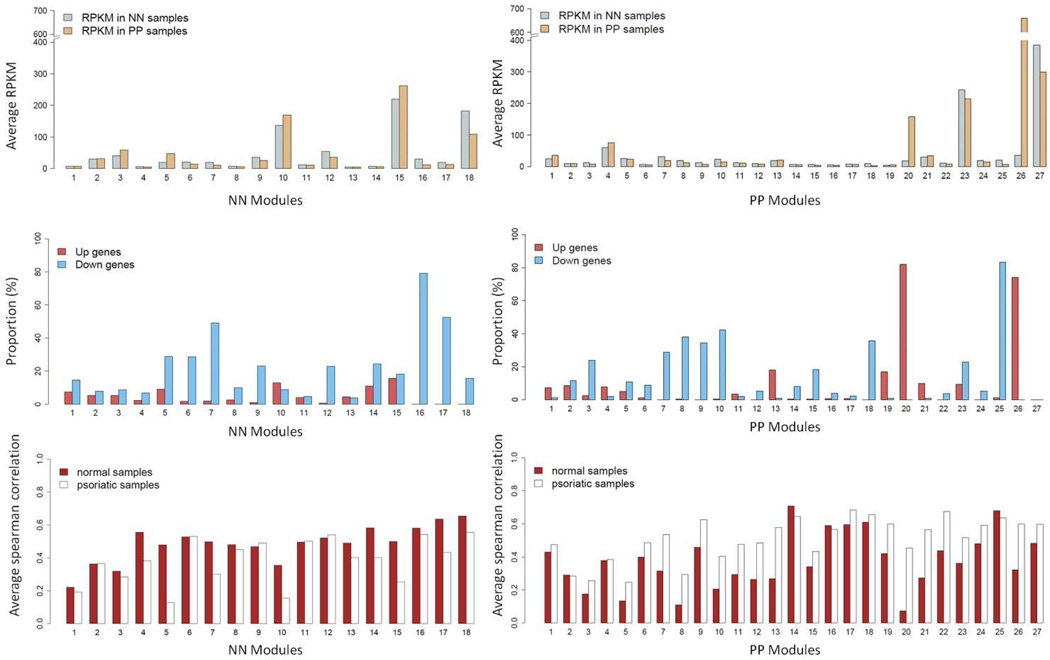
Figure 1. Averaged RPKM and proportion of DEGs for each module.
Averaged RPKM among the genes (top panel), proportions of up- and down-regulated genes (middle panel), and the average Spearman correlation (bottom panel) for the co-expression gene modules constructed from the normal (normal; left panel) and psoriatic (psoriatic; right panel) skin samples, respectively.

