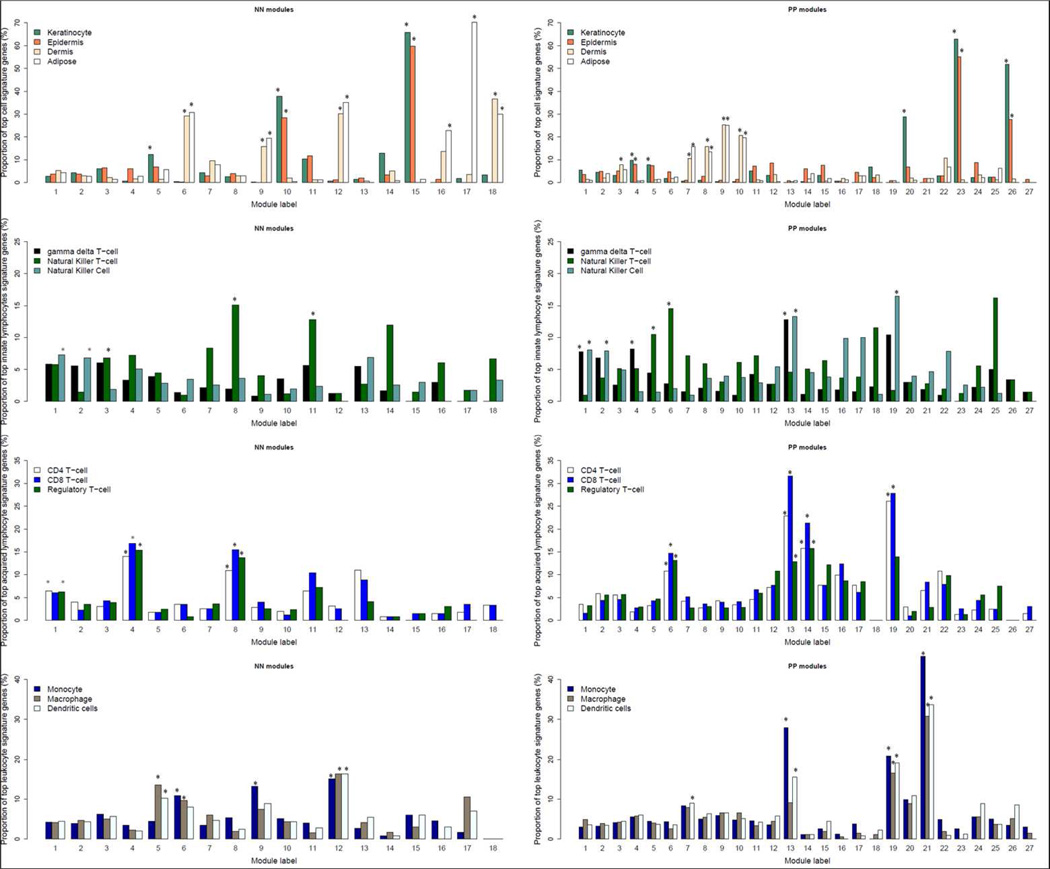
Figure 2. Proportion of top signature genes in different cell populations for co-expression gene modules constructed from normal (left panel) and psoriatic (right panel) skin samples.
From the top to bottom, respectively, the four panels show the proportions of signature genes for different skin cell and tissue compartments (keratinocytes, epidermis, dermis, and adipose tissue); "innate immunity" lymphocytes (gamma-delta T-cells, natural killer (NK) cells, and NK-T cells); "adaptive immunity" lymphocytes (CD4+ T-cells, CD8+ T-cells, and regulatory T-cells); myeloid-derived leukocytes (monocytes, macrophages, and dendritic cells). Asterisks (*) denote significant (ie p< 1 × 10⁻⁴) enrichment for the top 5% of cell signature genes in the corresponding module.

