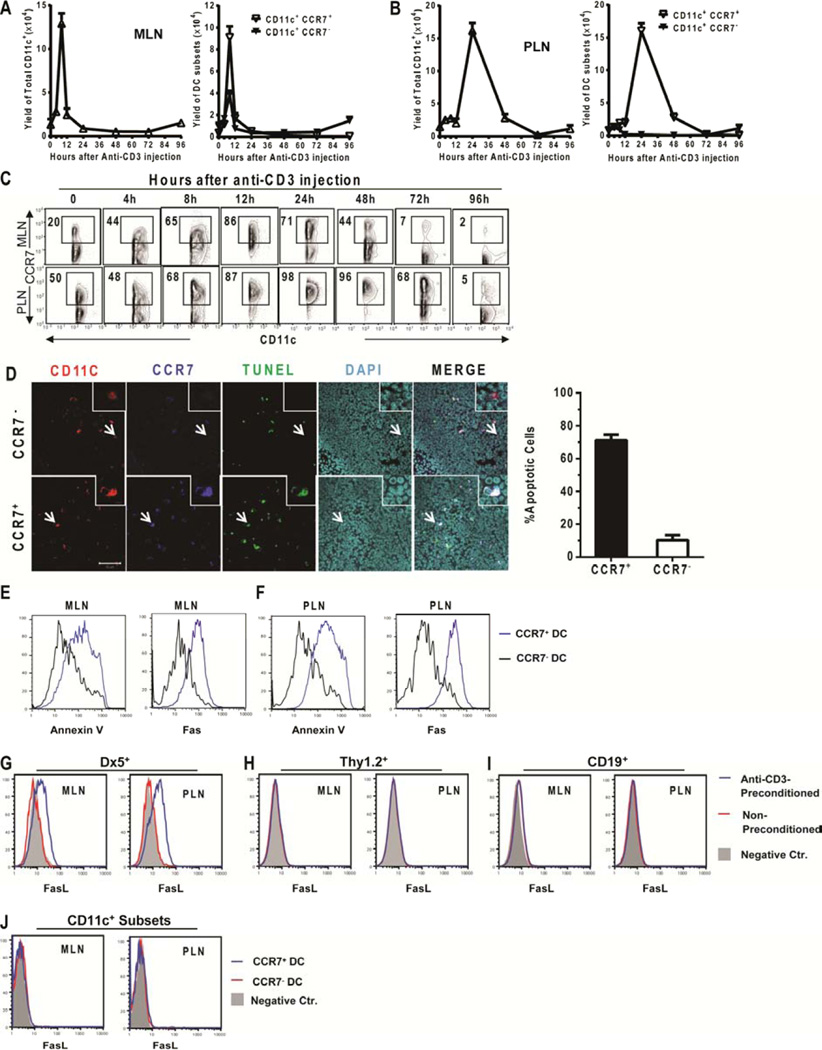
Figure 4. Treatment with anti-CD3 mAb induced sequential expansion and apoptosis of CCR7+ DC in MLN and PLN.
(A and B) BALB/c mice were treated with anti-CD3 mAb. (A–C) At the indicated time-points, mononuclear cells from MLN and PLN were analyzed for the percentages and numbers of total CD11c+ DCs and the CD11c+CCR7+ and CD11c+CCR7− subsets by flow cytometry. Results are shown as the kinetic curve of the mean ± SE of 5 replicate experiments. (D) Eight hours after antibody injection, MLNs were harvested (N = 4 mice) and tissue sections were stained as follows: TUNEL indicating apoptosis (green), CD11c (red), CCR7 (blue) and DAPI (light blue). Slides were imaged at 40x magnification. Insets show 8× magnified view of image. Arrows indicate apoptotic CCR7+ DCs (lower panel) and non-apoptotic CCR7− DCs (upper panel). Apoptotic CCR7+ or CCR7− DCs were counted and shown as a percentage of CCR7+ or CCR7− DCs, respectively (N=4 mice, mean± SE). (E–F) Eight hours after antibody injection, mononuclear cells from MLN or PLN were stained for CD11c, CCR7 and Annexin V or Fas. Histograms of Annexin V or Fas staining on gated CD11chi CCR7+ cells (blue line) and CD11chi CCR7− cells (black line) are shown. Results are representative of 3 replicate experiments. (G–I) Eight hours after anti-CD3 injection, mononuclear cells from the MLN and PLN were stained for DX5, Thy1.2, CD19, or CD11c versus FasL. Gated (G) DX5+, (H) Thy1.2+, (I) CD19+, or (J) CD11c+ cells were shown in histogram of FasL. (G–I) Histograms are overlaid: with or without anti-CD3-preconditioning and negative control. Negative control is filled in grey, non-conditioned BALB/c is red, and anti-CD3-preconditoned is blue. (J) Histograms are overlaid: CCR7+ CD11c+, CCR7− CD11c+ and negative control. Negative control is filled in grey, CCR7−CD11c− is red, and CCR7+CD11c+ is blue. Results are representative of N=4 mice per group.

