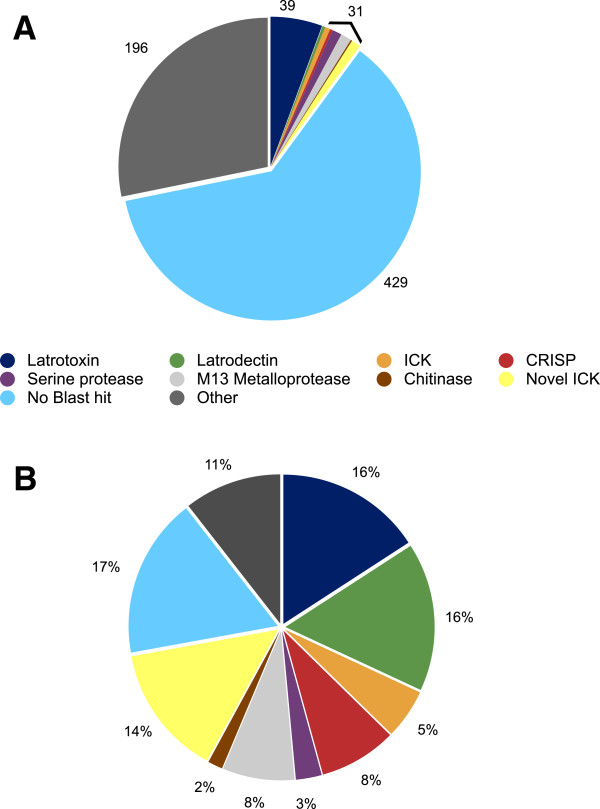
Figure 8.

Summary of diversity and expression of L. hesperus venom gland specific transcripts. (A) The proportion of total distinct venom gland specific transcripts assigned to several known toxin types or enzymes by BLASTx significant similarity, and assigned to all other categories labeled as “other”, or lacking a significant BLAST hit. The numbers of sequences in the smaller categories were summed for clarity. (B) Overall expression as % of total FPKM in the venom gland specific set using these same categories.
