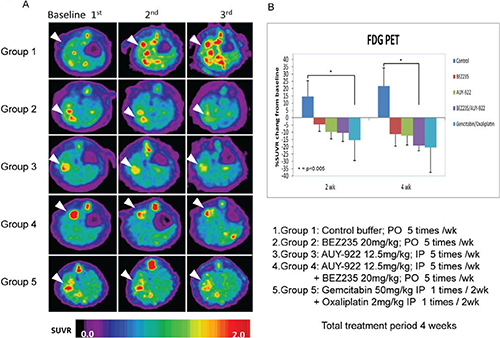
Figure 5. Detection of rat CCA by animal PET and changes in the tumor/liver SUV ratio.

(A) Coronal views of fused CT and PET scans of control and experimental rats revealed the CCA-expressing areas of the liver in which the 18F-FDG uptake was higher than baseline at 2–5 wk after the experiment (i.e., wk 20, 22, and 25). (B) Change in the tumor-to-liver (T/L) ratio of SUV in the control and experiment groups at 2–5 wk after the experiment (i.e., wk 22 and 25).
