
Figure 1. YB-1 expression increases with increase in tumor grade and is negatively correlated with E-cadherin expression in human PCa tissues.
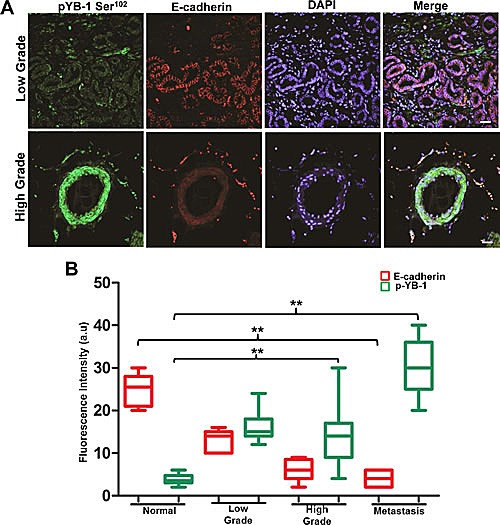
Representative immunofluorescence images of human PCa tissues stained for YB-1 and E-cadherin. Human PCa tissue array containing a total of 42 cores; normal (n=8), low grade (n=7), high grade (n=21), and metastasis (n=6) was co-stained with anti pYB-1 (Green) and E-cadherin (Red) antibodies. Image acquisition settings were kept identical to ensure the comparability between individual groups. scale bar=50 μm (B) Box plot analysis of fluorescence intensity of images in A using the NIH image J software. p-values were calculated using GraphPad prism v5.0 as described. *p<0.05 and **p<0.01. Fluorescence intensities are represented as arbitrary units. DAPI was used as a nuclear staining control.