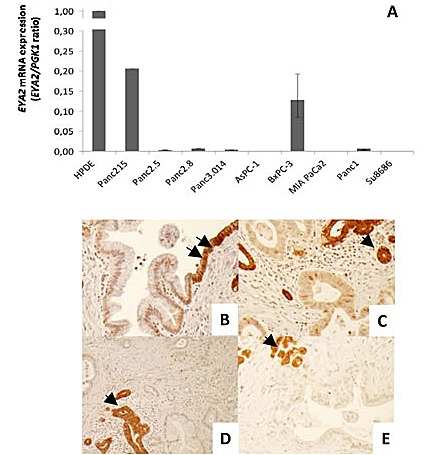
Figure 1. (A) EYA2 expression by real-time PCR in normal HPDE cells and nine pancreatic cancer cell lines.

(B-E) Representative figures of immunohistochemical staining of EYA2 with tissue microarrays. (B) Transition from normal ductal epithelium (arrows) to PanIN1. PanIN1 shows a decreased EYA2 expression. (C-E) Pancreatic ductal adenocarcinomas show a decrease or complete loss of EYA2 expression compared to entrapped normal ductal or acinar cells (arrows). Magnification: 10X.
