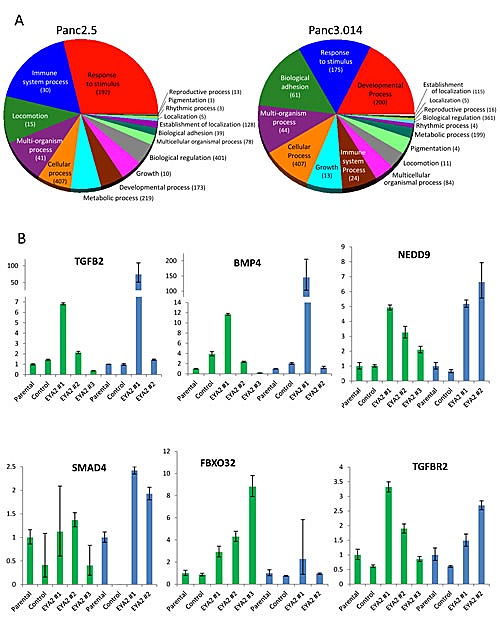
Figure 5.

(A) Summary of differentially expressed genes in Panc2.5 and Panc3.014 EYA2-overexpressing clones compared to control clones. Statistical analysis of gene expression array data as well as Gene Ontology classification were performed with Partek Genomic Suite 6.4 software. (B) Quantitative RT-PCR showing the expression profile of genes from the TGFbeta pathway in EYA2-overexpressing clones compared to control clones and untransfected cells (Parental) in Panc2.5 (green bars) and Panc3.014 (blue bars) cells. Bands were quantified by densitometry.
