
Figure 1. The decreased protein expression of GLS2 in human primary HCCs.
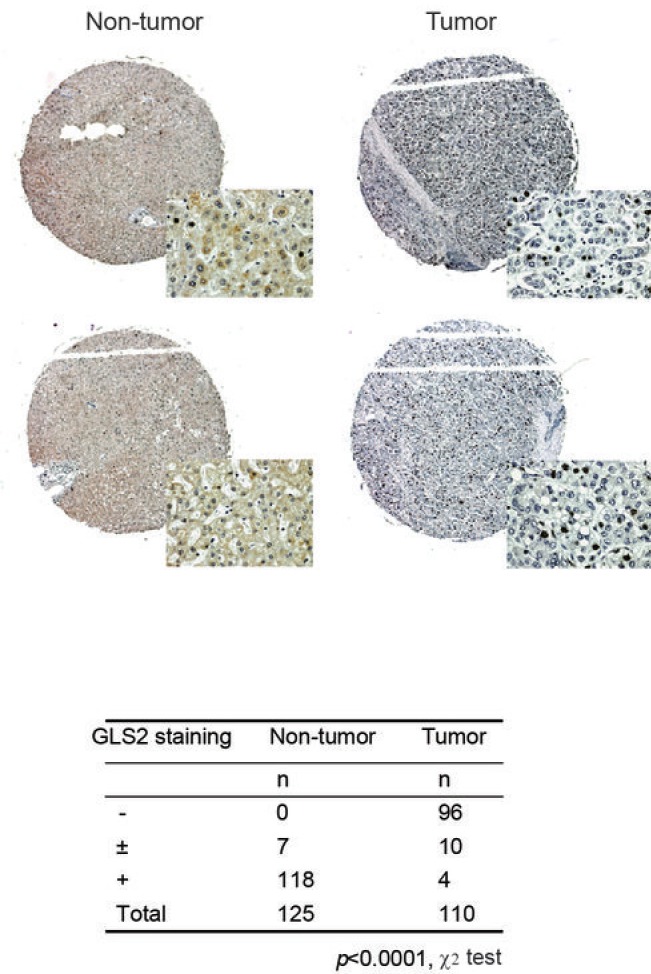
The GLS2 protein expression in HCC samples in three tissue microarrays (TMAs; US Biomax) as measured by IHC assays. The three TMAs contain totally 110 primary HCCs and 125 non-tumor liver samples. Upper panels: Representative IHC staining of GLS2 in 2 HCCs which showed negative staining (-) and 2 non-tumor liver tissues which showed positive staining (+). Lower panel: IHC staining results in the TMA. -: 0% positive staining cells; ±: <10% positive staining cells; +: ≥10% positive staining cells. The p values were calculated using χ2 tests. The clinico-pathological information of HCC samples was presented in Supplementary Tables S1 & S2.