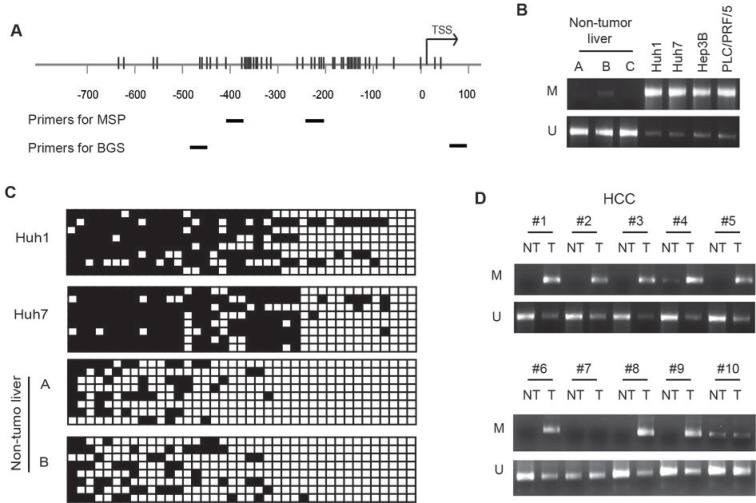
Figure 6. Hypermethylation of the GLS2 promoter in HCC cells and primary HCCs.
(A) CpG sites in the GLS2 promoter region. CpG sites and their genomic positions in the GLS2 promoter region are represented by vertical lines. Nucleotide positions are numbered relative to the transcriptional start site (TSS; +1). Positions of primers for methylation-specific PCR (MSP) and bisulfite genomic sequencing (BGS) assays are labeled. (B) Hypermethylation of the GLS2 promoter in HCC cells detected by MSP analysis. The methylation status of GLS2 promoter in 4 HCC cell lines and 3 non-tumor liver tissues (provided by Origene) were analyzed by MSP. U: PCR with unmethylation-specific primers; M: PCR with methylation-specific primers. (C) Hypermethylation of the GLS2 promoter in HCC cell lines analyzed by BGS analysis. Eight clones of PCR products of bisulfite-treated DNA from 2 HCC cell lines and 2 non-tumor liver tissues (Origene) were sequenced. Black and white squares represent methylation and unmethylation, respectively. (D) Hypermethylation of the GLS2 promoter in primary HCCs detected by MSP. The 21 pairs of primary HCCs and their matched non-tumor liver tissues were analyzed by MSP. Representative images are MSP results of samples #1-10. NT: Non-tumor liver tissue; T: Tumor.

