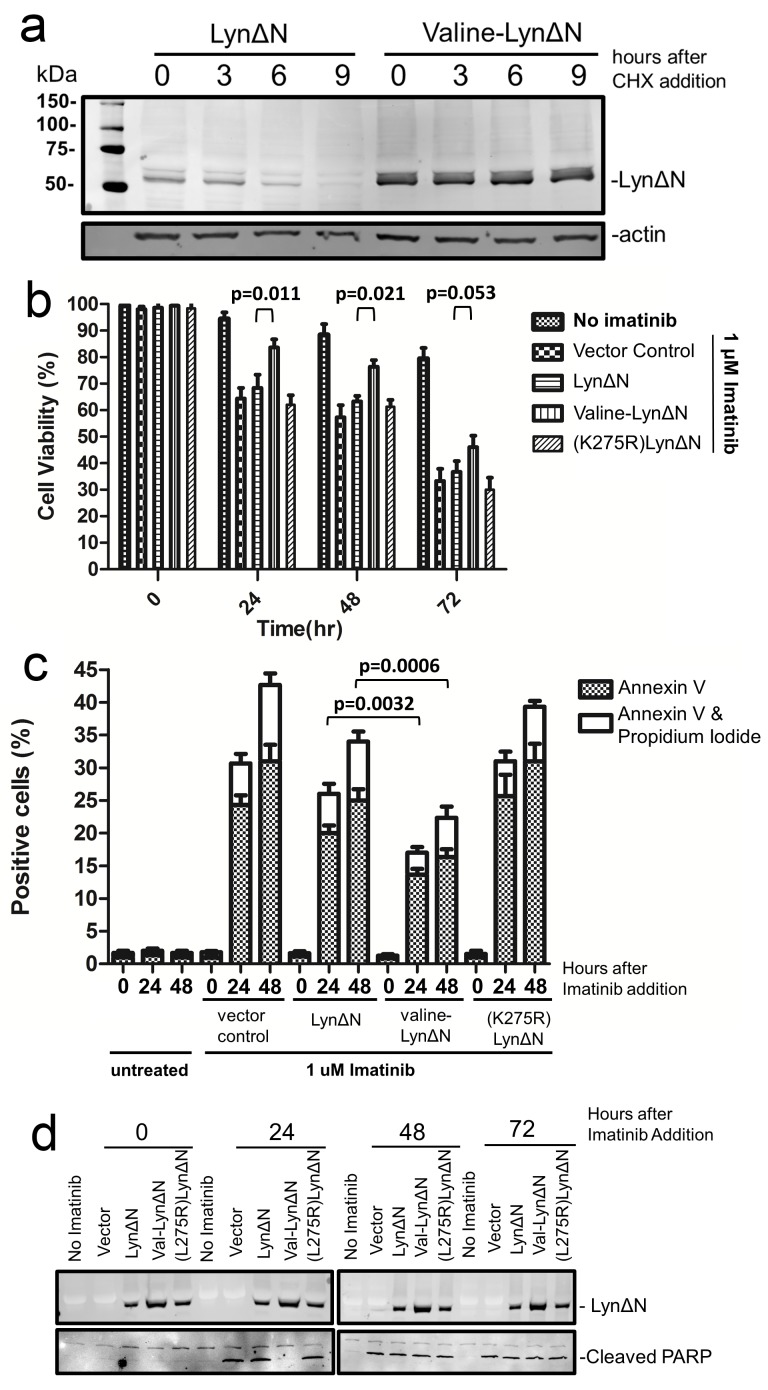
Figure 4. LynΔN induced imatinib resistance.
(a) Wild type LynΔN and valine-LynΔN were transfected into K562 cells, a CML derived cell line. After transfection the cells, CHX-chase experiment was done as previously described. The amount of LynΔN protein remaining was visualized by WB analysis with an anti-FLAG antibody and actin was analyzed as a loading control. (b) K562 cells were transfected to express the indicated proteins. Cells were then treated with imatinib for the indicated times then stained with trypan blue and analyzed on a TC20 automated cell counter (BioRad). The data represents the average and standard deviation from three independent experiments and p-values are derived from paired two tailed t-tests. (c) Quantified data from FACS analysis for K562 cells treated identically to those in (b). The percentage of cells that were stained with Annexin V (apoptotic cells) or both Annexin V and propidium iodide (dead cells) are shown. Cell staining was done with an Annexin V-FITC and propidium iodide. The data represents the average and standard deviation from three independent experiments. (d) Western Blot analysis of cell lysates from one set K562 cells used above. Blotting with an anti-FLAG antibody was used to detect LynΔN expression and an anti-PARP antibody was used to detect PARP cleavage.

