
Figure 1. (A) IDO mRNA levels in A549 clonal cell populations 24 h after addition of IFN gamma to induce IDO.
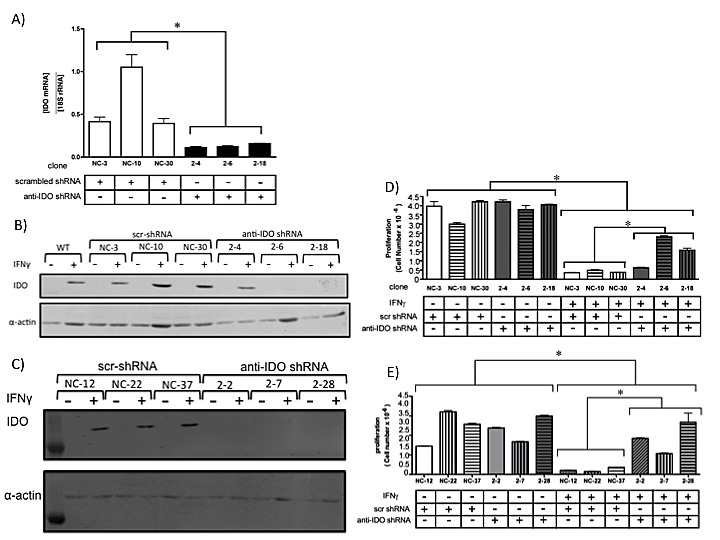
Bars indicate the means of 2 independent measurements (n=3 for each measurement) ± SD (*, p ≤ 0.05). (B) IDO protein levels in individual A549 clonal populations, with and without IFN gamma treatment (48 hours). (C) IDO protein levels in individual HeLa clonal populations, with and without IFN gamma treatment (48 hours). (D) Proliferation of A549 clonal populations harboring anti-IDO shRNA or scrambled control shRNA, treated or untreated with IFN gamma (25 ng/ml, 72 h). Bars indicate the mean of 3 independent measurements ± SD. (*p≤0.05). (E) Proliferation of HeLa clonal populations harboring anti-IDO shRNA or scrambled control shRNA, treated or untreated with IFN gamma (25 ng/ml, 72 h). Bars indicate the mean of 3 independent measurements ± SD. (*p≤0.05).