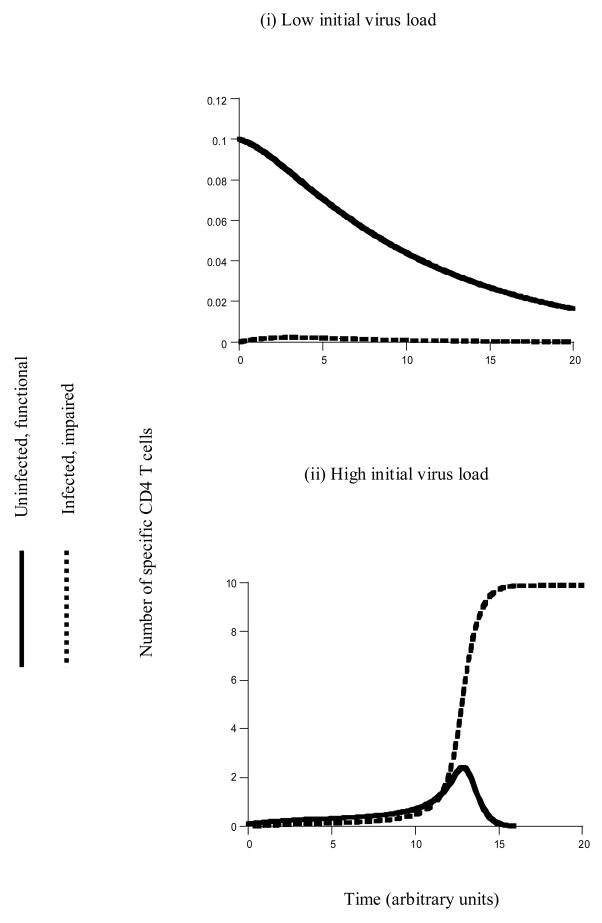
Figure 1.
Basic dynamics of HIV in specific CD4 T cells. The figure is based on model (2). It shows the outcome of infection depending on the initial conditions. (i) If the initial virus load is low, there is not enough antigenic stimulation to establish a CD4 T cell response. Consequently, infection in the specific CD4 T cell population also goes extinct. (ii) If the initial virus load is high, there is enough antigenic stimulation to establish the CD4 T cell response. Consequently, the infection is also established. The virus spreads through the entire population of HIV-specific CD4 T cells and attains 100% prevalence in this population (that is, all specific T cells are infected). Parameters were chosen as follows. r=1, d=0.1, k=10, β=0.2, a = 0.2, η=1, u=0.5. Initial conditions were as follows: x0=0.1, y0=0; for (i) v0=0.1; for (2) v0=1.

