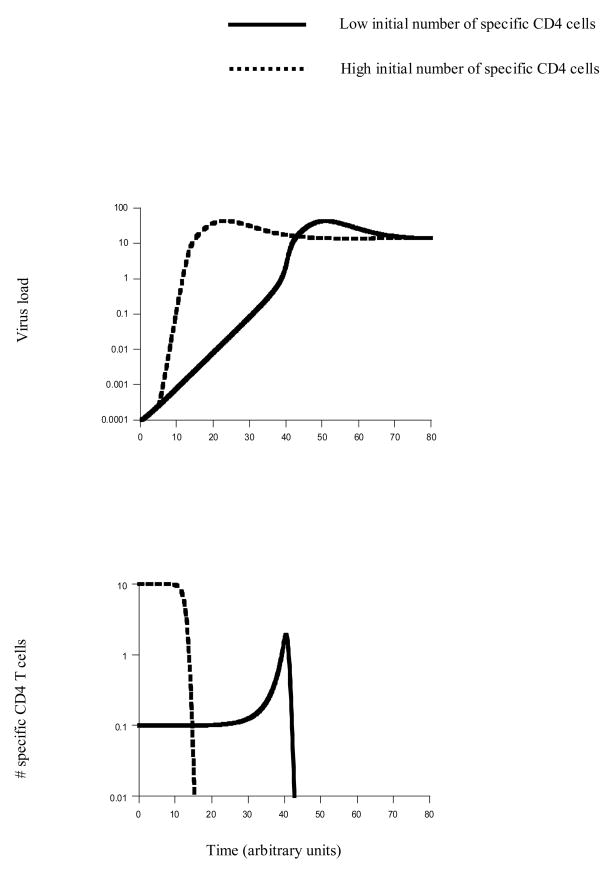
Figure 2.
Virus growth and the impairment of help as a function of the initial number of specific CD4 T cells. The figure is based on model (3) which contains both specific and non-specific target cells. (i) Virus growth: The very first phase of virus growth is the same, regardless of the initial number of specific CD4 T cells. This is because the infection is initiated in the non-specific target cells and it is assumed that specific T cells only become infected after a certain time threshold, because it will take some time for virus to meet the majority of HIV-specific T cells (the virus enters through mucosal surfaces and then makes its way to the blood where the majority of T cells are located). Subsequently, the rate of virus growth depends on the initial number of specific CD4 T cells. The higher the initial number of CD4 T cells, the faster the rate of virus growth. Both time series eventually converge to the same equilibrium. The reason is that this model does not contain any immune effector responses. (ii) Dynamics of functional specific CD4 T cells. We define this population as uninfected T cells. This assumes that infected T cells are impaired. A high initial number of specific CD4 T cells results in a fast decline of functional helper cells. If the initial number of specific CD4 T cells is lower, functional helper cells remain at higher levels for a longer period of time. In the simulation shown here, the population of specific CD4 T cells actually expands before declining to low levels. Parameters were chosen as follows. λ=1, r=1, δ=0.01, α=0.2, γ=0.005, β=0.3, d=0.001, a=0.2, k=10, η=1, u=1. Initial conditions were as follows: T0=λ/d, I0=0.0001, x0=0.1 or x0=10, y0=0, v0=ηI0/u.

