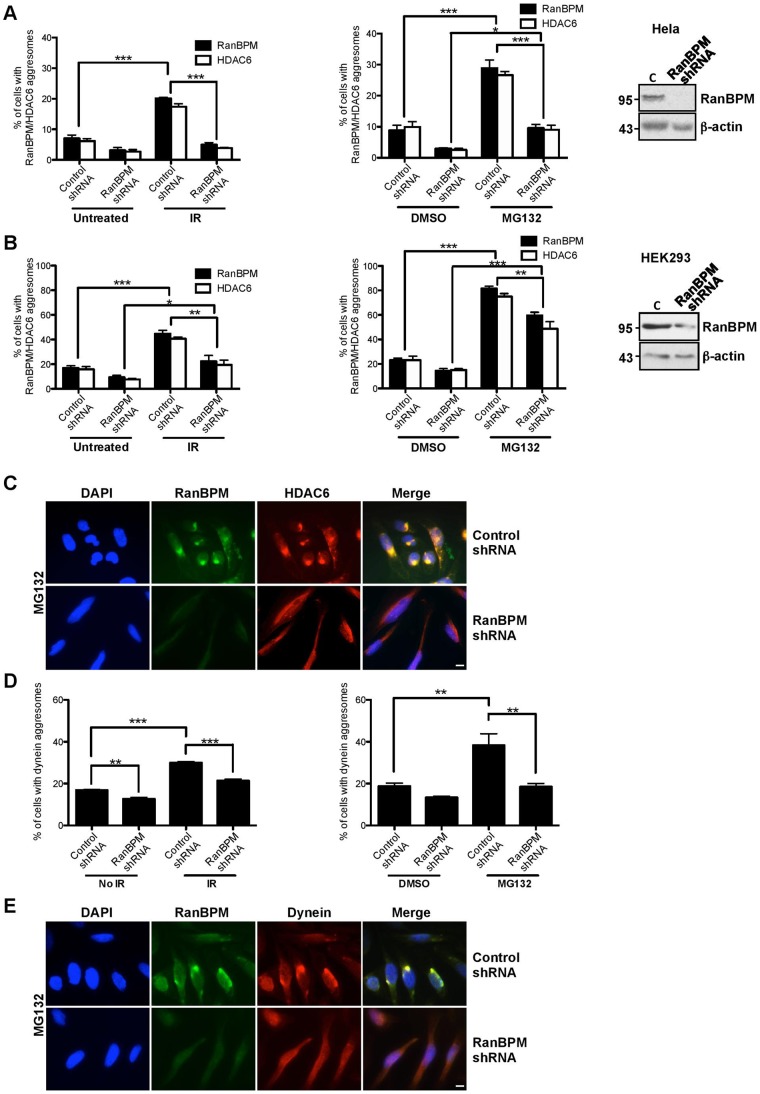
Fig. 2. RanBPM downregulation impairs aggresome formation.
(A) Hela cells stably expressing control shRNA or RanBPM shRNA were subjected to IR treatment (10 Gy) or left untreated, or treated with MG132 (10 µM) or vehicle (DMSO) and fixed 72 h following IR or 16 h following MG132. Cells were processed for immunostaining with antibodies to RanBPM and HDAC6 and mounted with DAPI. At least 150 cells were scored per experiment for the presence of RanBPM and HDAC6 aggresomes and the results (IR treatment, left graph, and MG132 treatment, right graph) are expressed as percentage of cells containing RanBPM aggresomes (solid bars) or HDAC6 aggresomes (open bars). Results are averaged from three different experiments, with error bars indicating SE. Asterisks indicate statistical significance for the differences in percentage of aggresomes obtained in control versus RanBPM shRNA cells, P<0.0005 (***); P<0.005 (**); P<0.05 (*). Inset, western blot analysis of extracts from Hela control and RanBPM shRNA cells, showing RanBPM expression with respect to a β-actin loading control. (B) HEK293 cells expressing control or RanBPM shRNA were processed and analyzed as described in panel A. Results are expressed as in panel A. Inset, western blot analysis of extracts from HEK293 control and RanBPM shRNA cells, showing the levels of expression of RanBPM versus β-actin used as a loading control. (C) Representative images of Hela cells stably expressing control shRNA or RanBPM shRNA treated with 10 µM MG132 and processed with antibodies to RanBPM and HDAC6 as described in panel A. (D) Hela cells stably expressing control shRNA or RanBPM shRNA were processed with antibodies against RanBPM and dynein and analyzed as described in panel A. The graphs (IR treatment, left graph, and MG132 treatment, right graph) show the percentage of cells containing dynein aggresomes. (E) Representative images of Hela cells stably expressing control shRNA or RanBPM shRNA treated with 10 µM MG132 and processed with antibodies to RanBPM and dynein as described in panel D. Scale bars: 10 µm.

