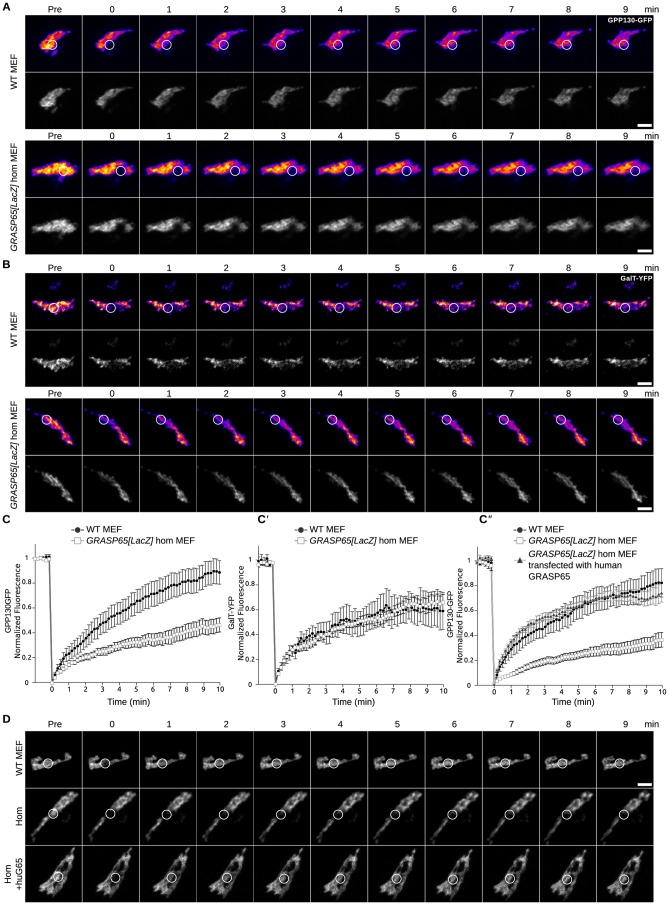
Fig. 7. FRAP on immortalised MEFs reveals specific cis Golgi unlinking.
(A) Time course of Golgi fluorescence recovery after photo-bleaching of GPP130-GFP in wild type (WT) and GRASP65[LacZ] homozygous (Hom) MEFs. White circles encompass the photo-bleached region. The top row shows a heat map of intensity from yellow (strong) to blue (weak). (B) Time course of Golgi fluorescence recovery after photo-bleaching of GalT-YFP in wild type (WT) and GRASP65[LacZ] homozygous (Hom) MEFs. White circles encompass the photobleached region. (C–C″) Fluorescence levels in bleached region is measured and is plotted versus time (n = 10 cells, mean ± s.e.m., *P<0.05, n.s. = not significant). Panel C corresponds to panel A, panel C′ to panel B, and panel C″ to panel D. (D) Time course of Golgi fluorescence recovery after photo bleaching of GPP130-GFP in wild type (WT) and GRASP65[LacZ] homozygous (Hom) MEFs as well as Hom MEFs back transfected with human GRASP65. White circles encompass the photobleached region. Scale bars: 5 µm (A,B,D).

