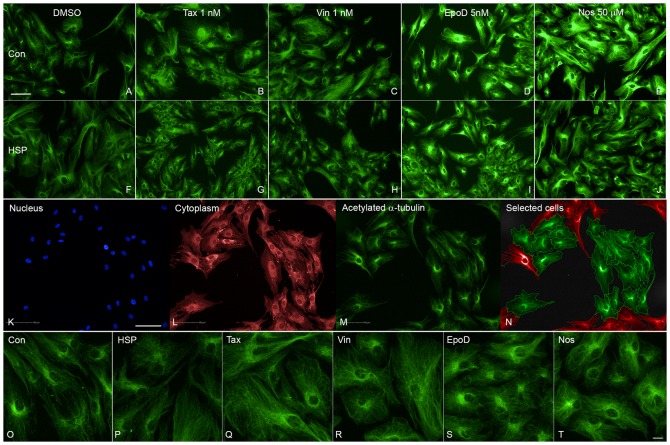
Fig. 1. Tubulin-binding drugs increased acetylated α-tubulin levels in patient-derived cells.
(A–E) Images of a control-derived ONS cell line showing increased fluorescence and disrupted acetylated α-tubulin microtubules after exposure to DMSO diluent alone and to moderate doses of taxol (Tax), vinblastine (Vin), epothilone D (EpoD) and noscapine (Nos) at the concentrations indicated. (F–J) Images of a patient-derived ONS cell line showing similar effects of moderate doses of taxol (Tax), vinblastine (Vin), epothilone D (EpoD) and noscapine (Nos) at the concentrations indicated above. (K–N) Images of the same field of cells showing (K) nuclei (blue, DAPI), (L) cell cytoplasm (red, CellMask), and (M) acetylated α-tubulin (green, immunofluorescence). (N) Image showing cells included for automated analysis (green) or excluded (red). Automated identification of cell boundaries is shown as lines. acetylated α-tubulin immunofluorescence (green) was quantified within the cell boundary and the nuclear boundary. (O–T) Higher power images showing acetylated α-tubulin immunoreactivity in (O) control-derived ONS cells (Con) and (P) patient-derived ONS cells (HSP) exposed to DMSO only and the same patient-derived cell line to low doses of taxol (0.5 nM, Tax), vinblastine (0.05 nM, Vin), epothilone D (2 nM, EpoD) and noscapine (10 µM, Nos). Scale bars: 100 µm (A–N), 20 µm (O–T).

