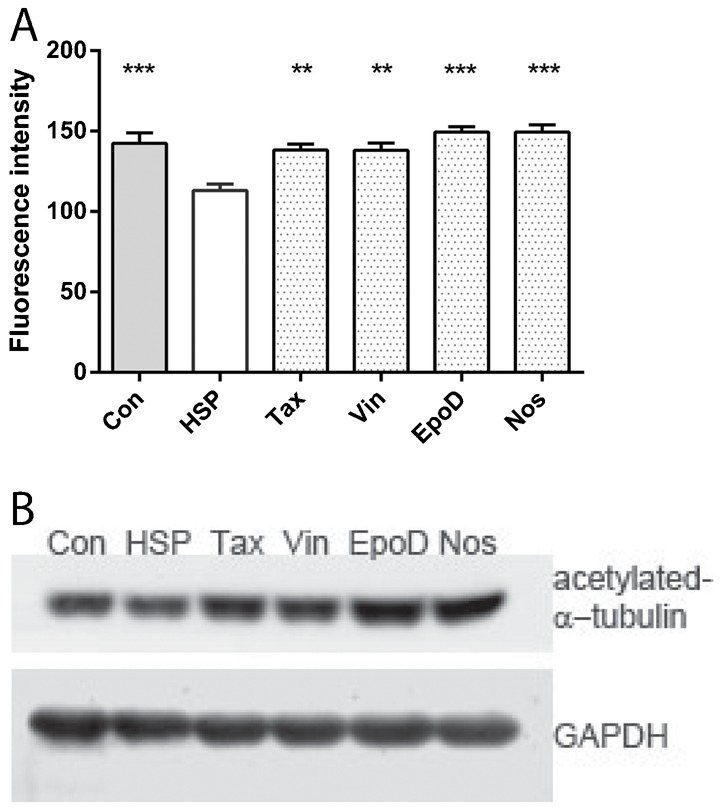
Fig. 2. Tubulin-binding drugs rescued acetylated α-tubulin levels in patient-derived cells.

(A) acetylated α-tubulin fluorescence intensity was significantly different among the groups (ANOVA, p<0.0001). Data are mean ± SEM of the mean per cell fluorescence intensity averaged across cell lines: control-derived cells, n = 8 cell lines from 8 different individuals; patient-derived cells, n = 9 cell lines from 9 different individuals. Con: control-derived cell lines treated with DMSO alone; HSP: patient-derived cell lines treated with DMSO alone; Tax: patient-derived cell lines treated with 0.5 nM taxol; Vin: patient-derived cell lines treated with 0.5 nM vinblastine; EpoD: patient-derived cell lines treated with 2 nM epothilone D; Nos: patient-derived cell lines treated with 10 µM noscapine. Post-hoc tests indicated that the means of all other groups were significantly different from the HSP group: *p<0.05; **p<0.01; ***p<0.001. (B) Western blot showing acetylated α-tubulin levels compared to GAPDH control levels in cell lines treated with the same drugs.
