
Figure 2.
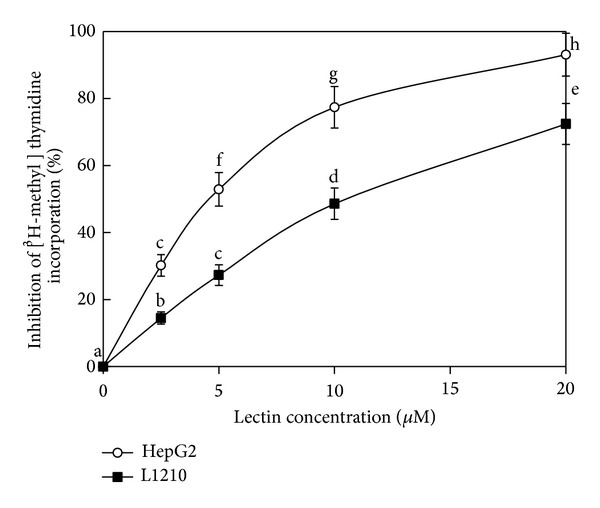
Antiproliferative activities of BSH towards Hep G2 and L1210 cell lines in vitro. The IC50 values towards Hep G2 and L1210 cells were 4.7 μM and 7.0 μM, respectively. Each value in both panels represents the means ± SD (n = 3). Different letters (a, b, c,…) next to the data points indicate statistically significant differences (P < 0.05) when the data were analyzed by analysis of variance followed by Duncan's multiple range tests.