Fig. 7.
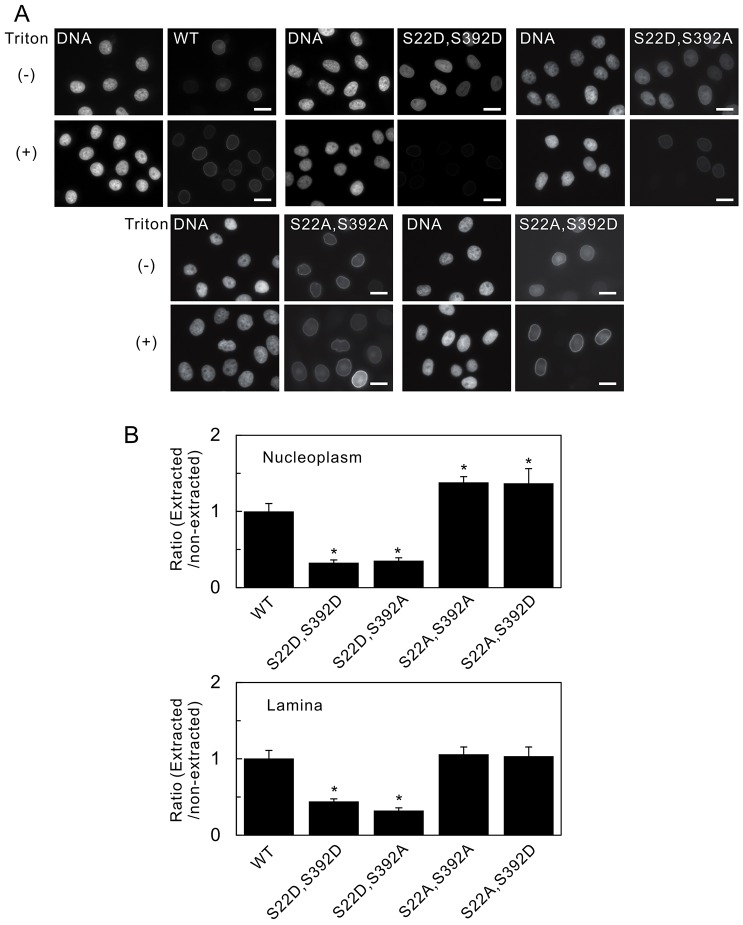
The phosphorylation sites that determine nucleoplasmic distribution also affect the solubility of lamin A. The fluorescence intensities of wild-type (WT) GFP–lamin A and the double mutants S22D S392D, S22D S392A, S22A S392A and S22A S392D, which were expressed in HeLa cell nuclei, were measured quantifiably by fluorescence microscopy, with and without detergent extraction (see Materials and Methods). (A) Fluorescence images of cells without (−) and with (+) detergent extraction before fixation. Pairs of images, of the same field, are shown – the left-hand image of the pair shows DNA (stained with Hoechst 33258) and the right-hand image of the pair shows the fluorescence of the indicated lamin A protein. Scale bars: 10 µm. (B) Fluorescence intensities were determined in the nucleoplasm (top panel) and the lamina (bottom panel). The data were quantified, and the relative ratios of the fluorescence intensities (extracted/non-extracted) were calculated and normalized to that of the WT (set as 1, see Materials and Methods). Compared with WT GFP–lamin A, the solubilities of the double mutants GFP–lamin A S22D S392D and S22D S392A were significantly higher. Error bars represent the s.e.m. *P<0.005 compared with that of WT GFP–lamin A.

