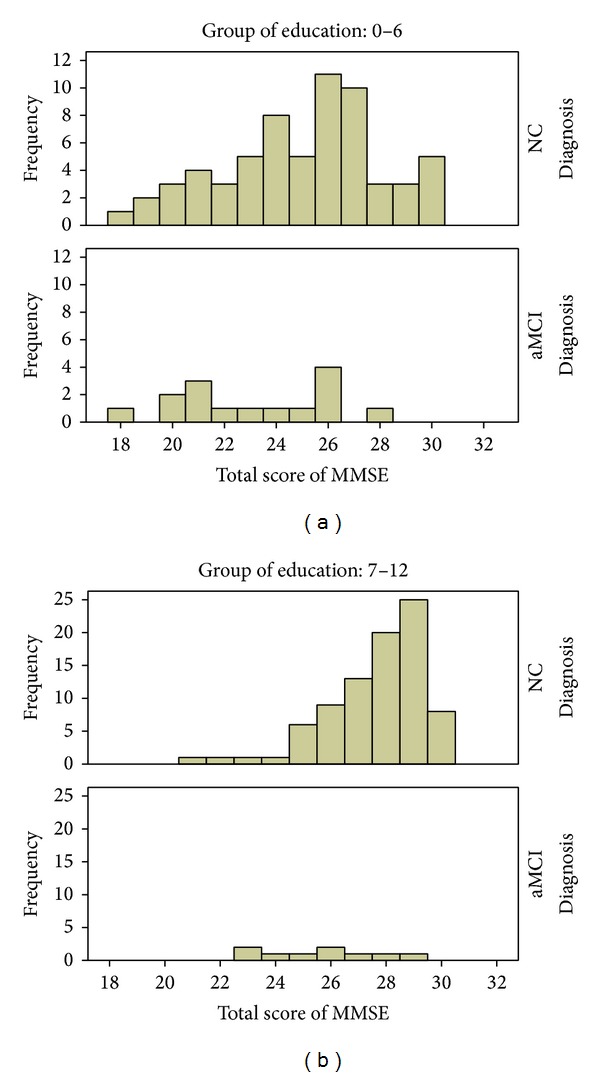
Figure 3.

Frequency distribution of C-MoCA scores by aMCI status and education groups. (a) The 0–6 years of education group; (b) the 7–12 years of education group. NC: the participants for normal control; aMCI: the participants for amnesic mild cognitive impairment.
