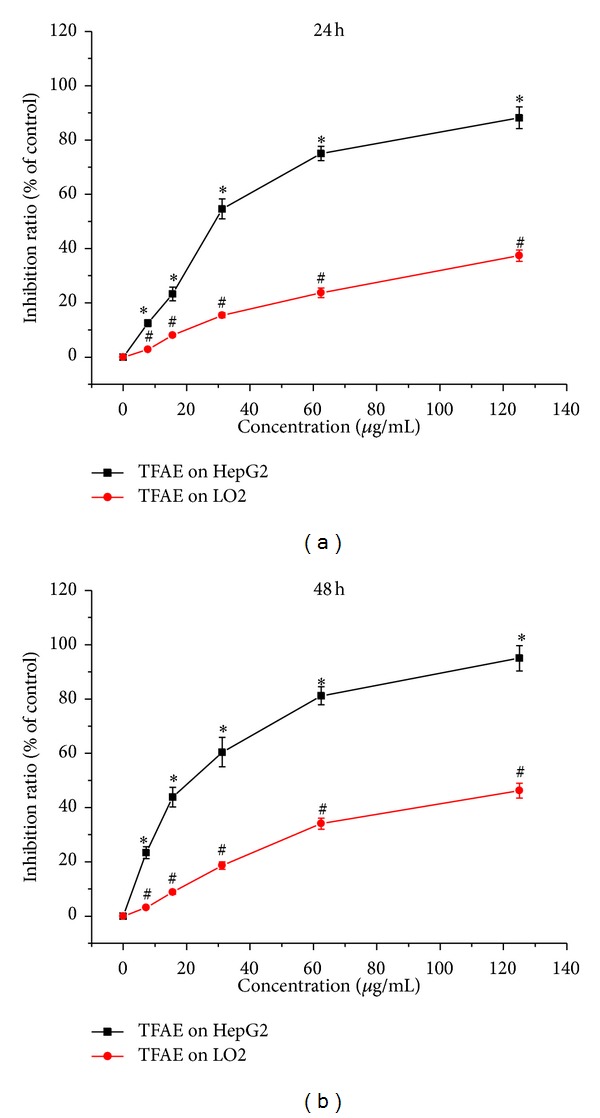
Figure 1.

The effect of TFAE on cell proliferation inhibition in HepG2 and LO2 cells for 24 or 48 h by CCK-8 assay. *P < 0.05, TFAE-treated group compared with the negative control group. # P < 0.05, the inhibition ratio of TFAE-treated LO2 cells group compared with TFAE-treated HepG2 cells group.
