
Figure 11.
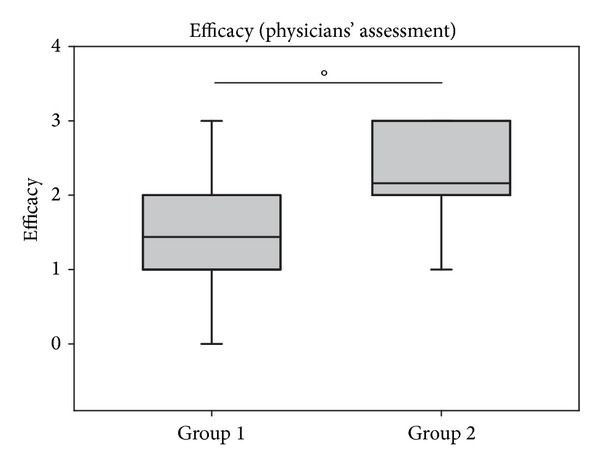
Assessment of efficacy of both treatments at site visit 2 (V2) by investigators. °P = 0.009. Lines within the box mark the median; the upper and lower ends of the box indicate the 75th and 25th percentiles, respectively. Whiskers above and below the box indicate the 90th and 10th percentiles. Dots (•) represent outlying points.