
Figure 3.
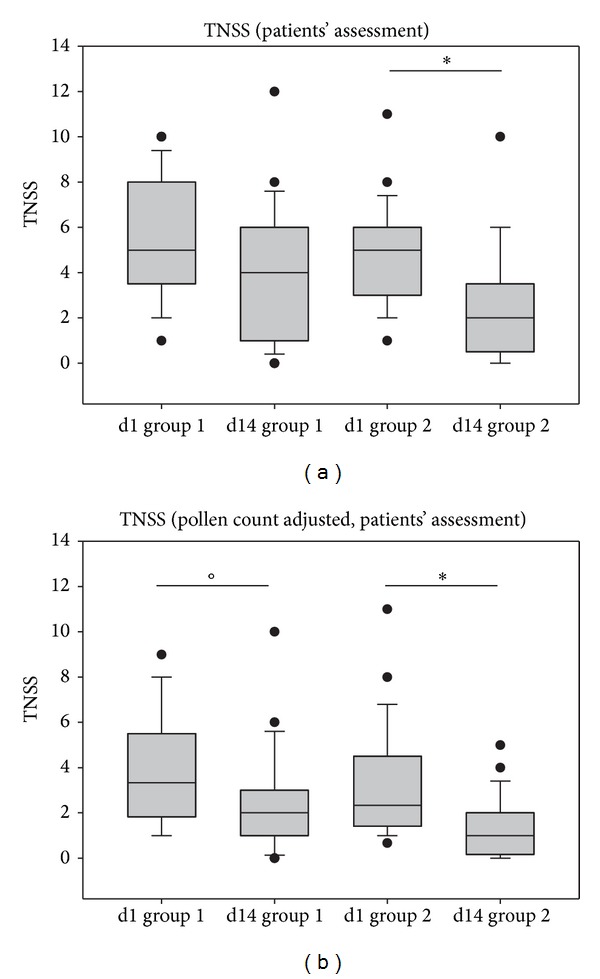
TNSS development during the study based on the patients' assessment of symptoms. (a) TNSS values on day 1 (d1) and day 14 (d14); (b) TNSS values adjusted for pollen counts, *P < 0.001, °P = 0.043. Lines within the box mark the median; the upper and lower ends of the box indicate the 75th and 25th percentiles, respectively. Whiskers above and below the box indicate the 90th and 10th percentiles. Dots (•) represent outlying points.