
Figure 6.
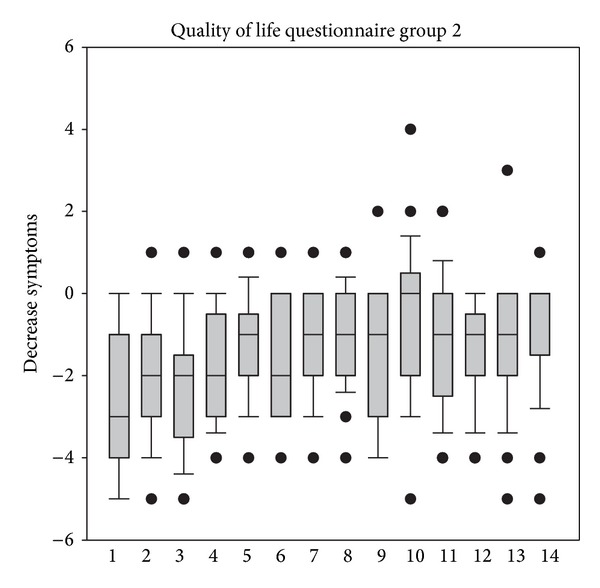
Reduction of scores of the quality of life questionnaire from V1 to V2 in group 1. 1 = frequency of tissue use, 2 = rubbing eyes and nose, 3 = frequency of brushing of nose, 4 = bad sleep, 5 = bad work performance, 6 = fatigue, 7 = thirst, 8 = lack of concentration, 9 = general well-being, 10 = headache, 11 = bad temper, 12 = general disconcertment, 13 = frustration, and 14 = reactions of others to the allergy.