
Figure 7.
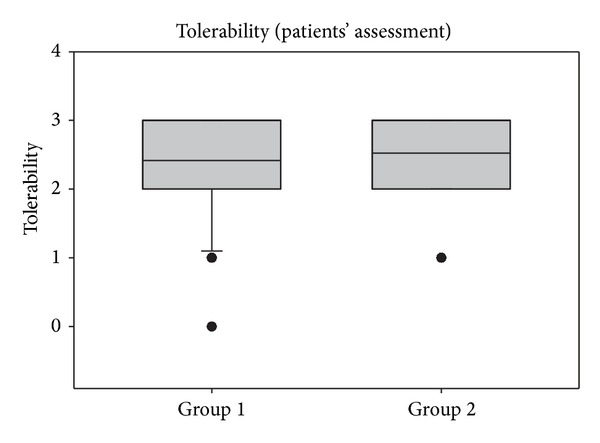
Tolerability assessments of patients during the entire study period of 14 days. Lines within the box mark the median; the upper and lower ends of the box indicate the 75th and 25th percentiles, respectively. Whiskers below the box indicate the 10th percentiles. Dots (•) represent outlying points.