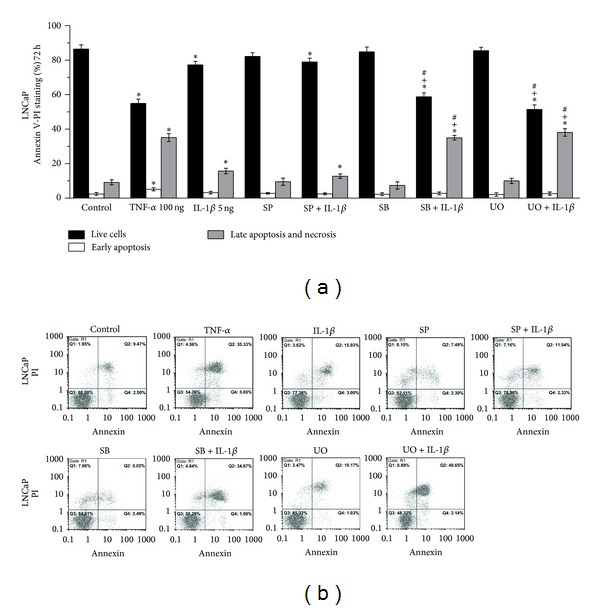
Figure 7.

Flow cytometry analysis of LNCaP cells using annexin V/PI staining. (a) Effects of TNF-α (100 ng/mL), IL-1β (5 ng/mL), SP600125 (30 μM), SΒ203580 (30 μM), and UO126 (30 μM) on apoptosis and necrosis of LNCaP cells. Cells were left untreated for 72 h (ctrl), or treated with the indicated cytokine or inhibitor alone for 72 h, or pretreated with the indicated inhibitor for 1 h and subsequently treated with the indicated cytokine for a total of 72 h (Statistically significant differences are depicted as follows: (∗) cytokine versus ctrl or inhibitor versus ctrl or inhibitor and cytokine versus ctrl (P < 0.05), (+) inhibitor and cytokine versus cytokine (P < 0.05), (#) inhibitor and cytokine versus inhibitor (P < 0.05)). (b) Representative histograms of cell distribution according to PI and annexin V staining as determined by flow cytometry (Q1 represents necrotic cells, Q2 late apoptotic and necrotic cells, Q3 live cells, and Q4 early apoptotic cells).
