
Figure 3.
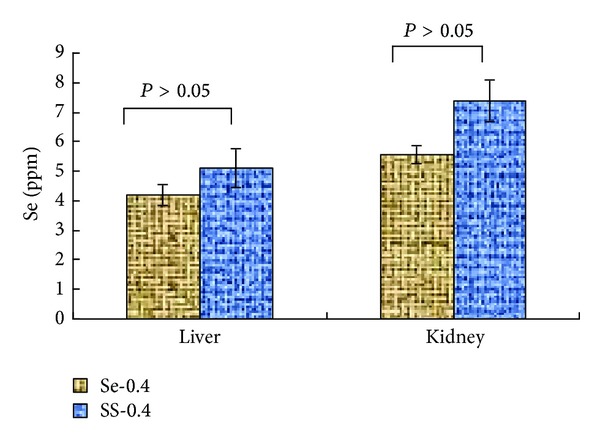
Se (ppm) in animal tissues (n = 6). The Se (ppm) was not significantly different between SS-0.4 and Se-0.4 group (P > 0.05).
Official websites use .gov
A
.gov website belongs to an official
government organization in the United States.
Secure .gov websites use HTTPS
A lock (
) or https:// means you've safely
connected to the .gov website. Share sensitive
information only on official, secure websites.
Se (ppm) in animal tissues (n = 6). The Se (ppm) was not significantly different between SS-0.4 and Se-0.4 group (P > 0.05).