
Figure 4.
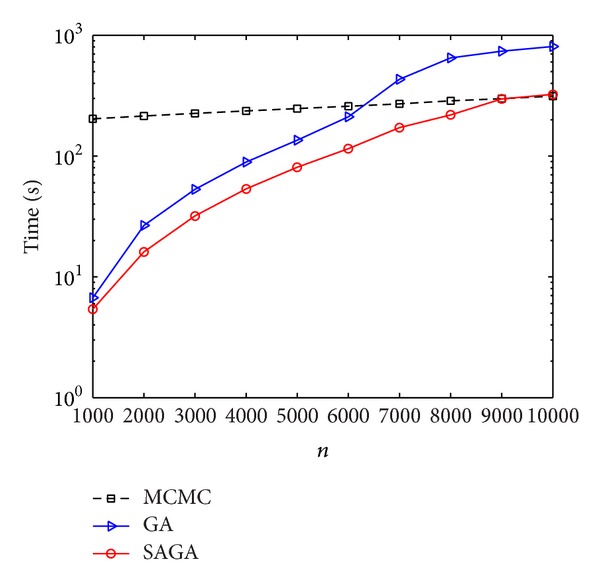
Comparison of computational time of SAGA, GA, and MCMC in terms of gene number from 1000 to 10000. In this plot, we use semilog coordinate (the y-axis) to show the computational time in seconds. All the makers correspond to the results of an average over 10 times.