
Figure 1.
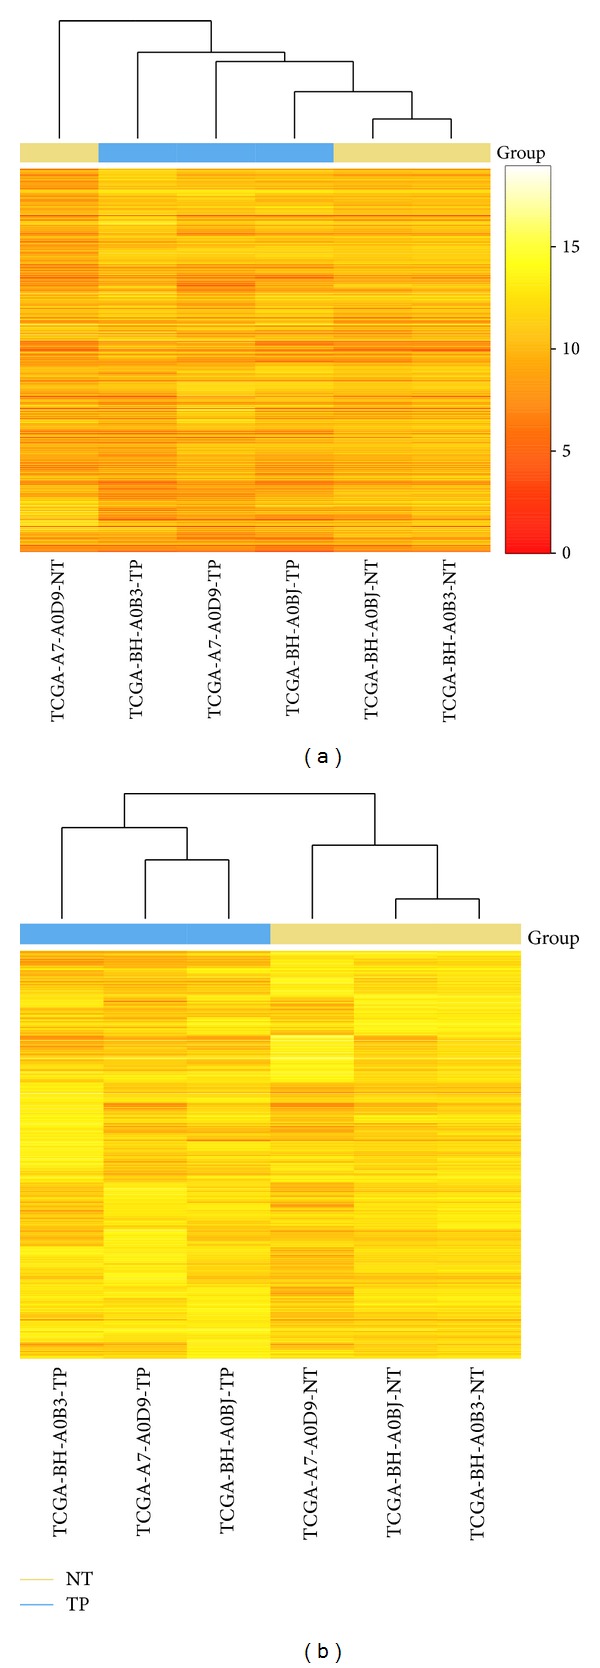
(a) Cluster result using all genes shows control 1 clustered together with disease group. (b) Cluster results using genes with top 5% coefficient of variation, control group, and disease group are now clustered correctly.
Official websites use .gov
A
.gov website belongs to an official
government organization in the United States.
Secure .gov websites use HTTPS
A lock (
) or https:// means you've safely
connected to the .gov website. Share sensitive
information only on official, secure websites.
(a) Cluster result using all genes shows control 1 clustered together with disease group. (b) Cluster results using genes with top 5% coefficient of variation, control group, and disease group are now clustered correctly.